- Trading
- Trading
- Markets
- Markets
- Products overview
- Forex
- Commodities
- Metals
- Indices
- Shares
- Cryptocurrencies
- Treasuries
- Platforms
- Platforms
- Platforms
- Platforms
- Platforms overview
- MetaTrader 4
- MetaTrader 5
- Education
- Education
- Education
- Education
- News & analysis
- Education Hub
- Economic calendar
- Help & support
- Help & support
- About
- Trading
- Trading
- Markets
- Markets
- Products overview
- Forex
- Commodities
- Metals
- Indices
- Shares
- Cryptocurrencies
- Treasuries
- Platforms
- Platforms
- Platforms
- Platforms
- Platforms overview
- MetaTrader 4
- MetaTrader 5
- Education
- Education
- Education
- Education
- News & analysis
- Education Hub
- Economic calendar
- Help & support
- Help & support
- About
- Home
- News & Analysis
- Cryptocurrency
- Bitcoin teetering above key $20,000 level
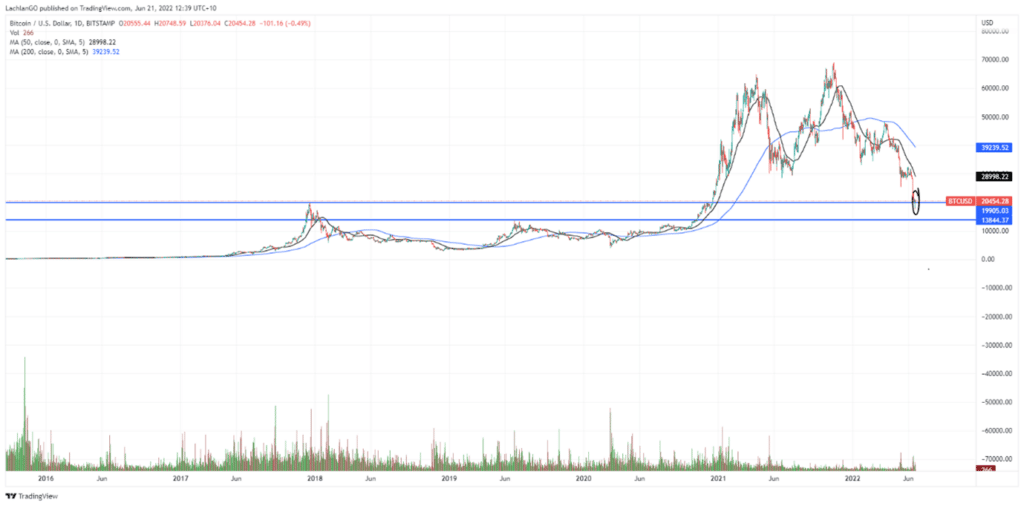
News & AnalysisBitcoin and other cryptocurrencies have seen their prices decline rapidly in recent times as inflation has wreaked havoc across the market. The capitulation has seen Bitcoin lose almost 75% of its value since November 2021. The aggressive selling has seen the price fall to its lowest levels since November 2020.
The theory that Bitcoin would be a hedge against inflation seems have dissipated as the volatility the price has fallen as interest rates have increased. This shows how Bitcoin correlates more with riskier assets as opposed to steadier inflation hedges such as gold. The volatility surrounding BTC also picked up after brokers such as Binance and Celsius both halted swaps and transfers of cryptocurrencies. This led not only to a drop in price but a significant drop in confidence as the market came to terms with the fact that the liquidity and ease of movement of the currency may not be as smooth as once thought.
The Role of Institutional Investors
The difference with the current Cryptocurrency Bear market and previous cycles is the role of institutional investors/traders. With Cryptocurrency ETF’s, coins tied to other currencies and funds now taking up large positions, the pure volume now in the market is significantly larger with larger position sizes. According to one Cryptocurrency broker, just 51% of its bitcoin holders are in the green. This signals that there is a great volume of supply and as prices continue to drop and pressure builds, the potential for capitulation is very high as panic sets in. Institutions are also able to take much larger positions with higher leverage. This means more aggressive moves down when their positions need to be liquidated.
The Magical $20,000 level
The support level that is screaming out to the market is the $20,000 level. It is the long-term support point going back almost 5 years and is a large psychological level. The price was able to break through last week, however it rallied hard and is currently holding above.
If the price can break through the magic $20,000 level, then it may trigger a range of stop losses and a surge of selling. The next support target should it break through would be approximately $14,000.
Looking further back, the most recent rise in price was unable to break through the 50 Day moving average before slipping lower. The 50 Day moving average is also becoming steeper indicating significant selling. Until the 50 Day moving average begins to plateau, it may be difficult for a rally to be sustained.

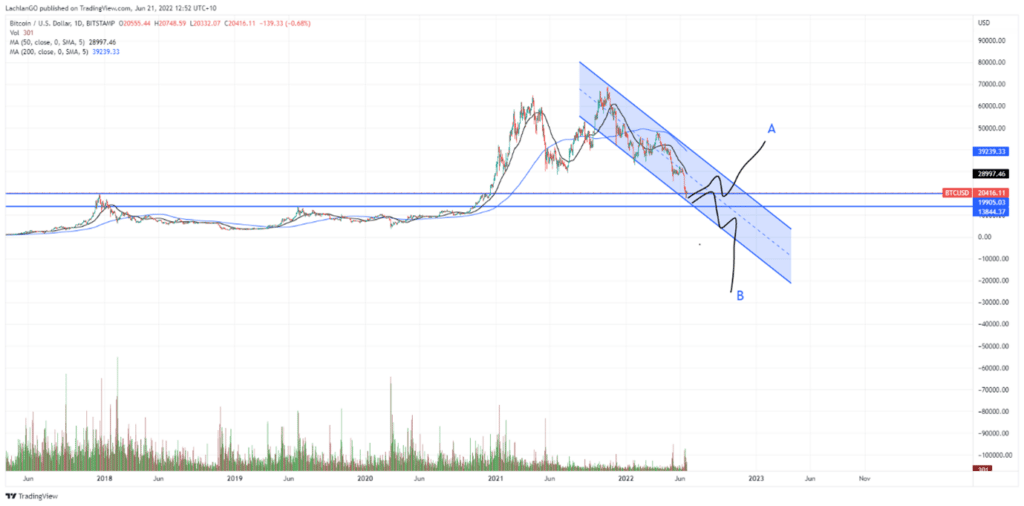
Bitcoin’s price can also be viewed in a downward channel beginning at its most recent peak. A breakout of the channel in either direction may give some indication of a change in trend as seen in the chart below.

Ethereum
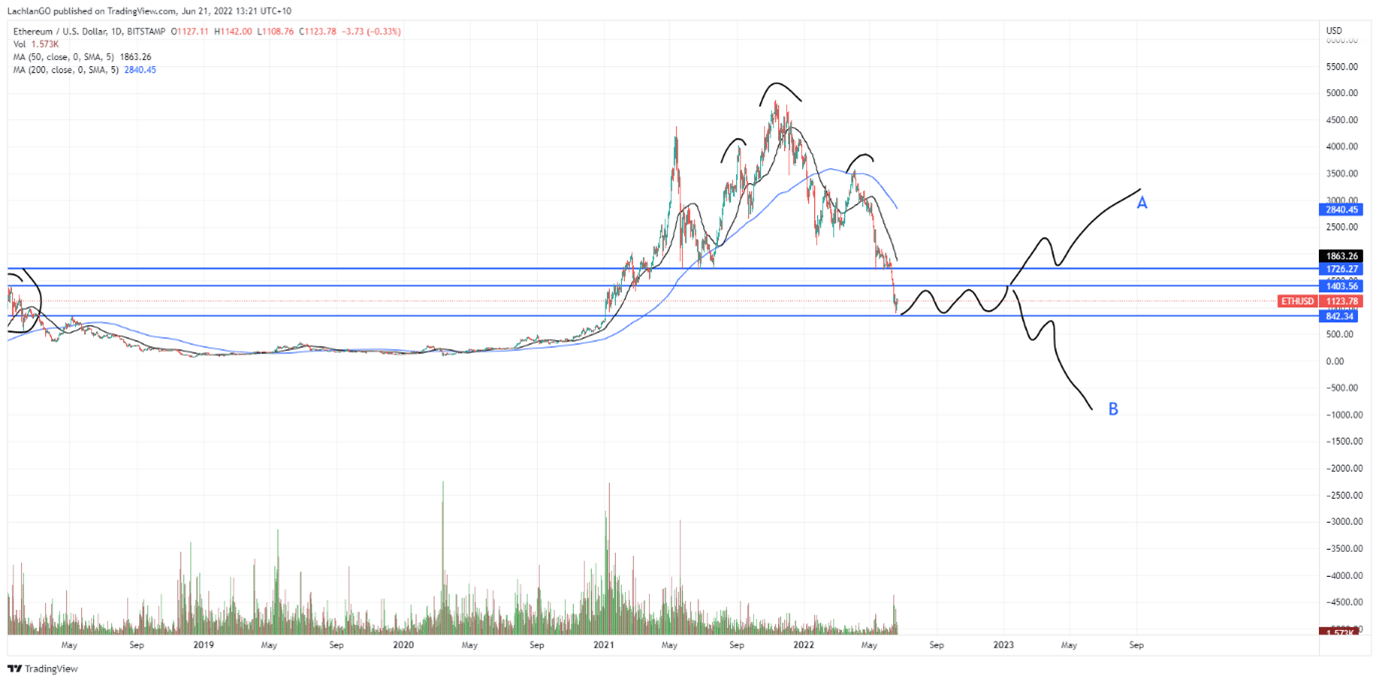
Ethereum has largely for the same reasons seen in Bitcoin as significant a drop as Bitcoin has. Whilst Bitcoin has shown a long term double top pattern, Ethereum looks more like a head and shoulders pattern which shows an equally exhausted price. The price has broken through almost all longer term supports. It was able to bounce near the $830-$860 level. However, this price may come under threat again if sentiment weakens. Regardless of the direction, the next move it will likely require some consolidation before it either breaks through or bounces up.

Looking further ahead, increased fears of a recession or an unexpected rise in interest rates may see further selling. Alternatively signs of slowing inflation or lower than expected interest rate hikes may see a rally or a consolidation of the price. However, in the short term, the cryptocurrency sector remains very bearish.
The information provided is of general nature only and does not take into account your personal objectives, financial situations or needs. Before acting on any information provided, you should consider whether the information is suitable for you and your personal circumstances and if necessary, seek appropriate professional advice. All opinions, conclusions, forecasts or recommendations are reasonably held at the time of compilation but are subject to change without notice. Past performance is not an indication of future performance. Go Markets Pty Ltd, ABN 85 081 864 039, AFSL 254963 is a CFD issuer, and trading carries significant risks and is not suitable for everyone. You do not own or have any interest in the rights to the underlying assets. You should consider the appropriateness by reviewing our TMD, FSG, PDS and other CFD legal documents to ensure you understand the risks before you invest in CFDs. These documents are available here.
Next Article
Accenture latest results announced
Accenture (ACN) reported its latest financial results before the market open in the US on Thursday. The Irish-American professional services company reported revenue of $16.159 billion for the third quarter of fiscal 2022 vs. $16.04 billion expected. Earnings per share missed analyst expectations for the quarter at $2.79 per share vs. $2.86 p...
June 24, 2022Read More >Previous Article
Adobe latest results are here
Adobe Inc. (ADBE) announced its latest earnings results after the closing bell on Thursday for its second quarter fiscal year 2022 ended June 3. Th...
June 20, 2022Read More >Please share your location to continue.
Check our help guide for more info.

- Trading

