- Trading
- Trading
- Markets
- Markets
- Products overview
- Forex
- Commodities
- Metals
- Indices
- Shares
- Cryptocurrencies
- Treasuries
- Platforms
- Platforms
- Platforms
- Platforms
- Platforms overview
- MetaTrader 4
- MetaTrader 5
- Education
- Education
- Education
- Education
- News & analysis
- Education Hub
- Economic calendar
- Help & support
- Help & support
- About
- Trading
- Trading
- Markets
- Markets
- Products overview
- Forex
- Commodities
- Metals
- Indices
- Shares
- Cryptocurrencies
- Treasuries
- Platforms
- Platforms
- Platforms
- Platforms
- Platforms overview
- MetaTrader 4
- MetaTrader 5
- Education
- Education
- Education
- Education
- News & analysis
- Education Hub
- Economic calendar
- Help & support
- Help & support
- About
- Home
- News & Analysis
- Cryptocurrency
- Is this Bitcoin rally real?
News & AnalysisBitcoin has rallied extremely hard to start the year as risk on sentiment returned to begin the year with the price of the leading cryptocurrency at its highest level since August of 2022.
Risk assets have been the play in early 2023 with hopes for a settling of interest rate hikes by major central banks. As the technology sector and other growth areas have continued to rise up the price of Bitcoin has followed. The price is almost 50% up from its lows in the middle of December 2022. With the macroeconomic factors still largely the main drivers of the risk sentiment and the upcoming Federal Reserve Funds to be announced on Thursday, the rate announcement could play a large role in the short term price action. The Fed is expected to increase the official rate by 25 bps. However, all eyes will be on the accompanying commentary that will provide important direction on the Fed’s future plans in the upcoming months. Moreover, a hawkish commentary will likely lead to a selloff in risk assets and dovish commentary the opposite.

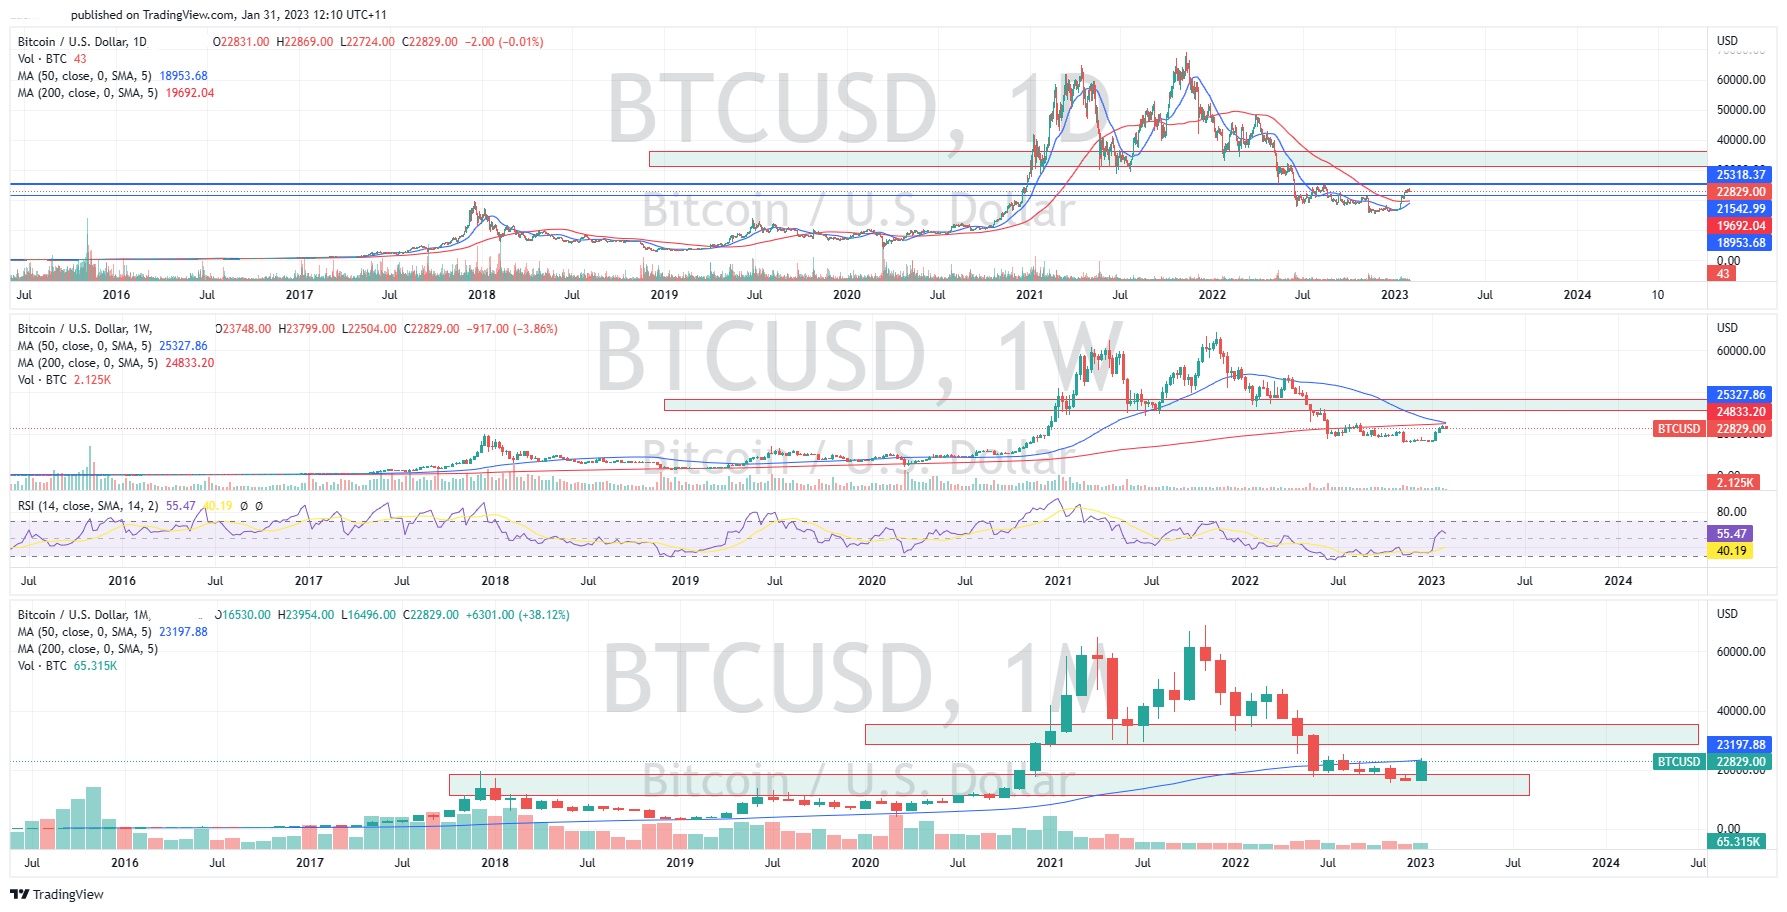
In terms of the long term perspective the price of Bitcoin has had its best month since October 2021. The price has made a significant bounce off the 15,000-20,000 support zone and looks to have reclaimed the 50 month moving average. This indicates a potential reversal or at least shift in sentiment. The next region of resistance is the original neckline of the long-term double top, between $30,000 and $40,000. It may be difficult for the price to break above this resistance in the short term without a catalyst. The other thing to remember is that there is a lot of supply that still needs to be worked through before any significant move upward can occur, although, the monthly candle is looking very encouraging. This next zone of resistance looks to be the primary target in the short to medium term for a long trade on Bitcoin.
Looking at the shorter term charts, they price actions tells a similar story. Specifically, on the daily chart, the price has seemingly paused as it awaits confirmation of a breakout at 25,000. If this breakout can be supported by some significant volume it may confirm the reversal. The other element that must be considered with Bitcoin is the potential for a short squeeze. With the asset so beaten down, it is possible that shorts will become squeezed leading to aggressive moves to the upside if momentum can begin to build.
Ultimately, the price action of Bitcoin will most likely be led by the overall risk sentiment in the market and as such traders should be weary of the overall market sentiment.
The information provided is of general nature only and does not take into account your personal objectives, financial situations or needs. Before acting on any information provided, you should consider whether the information is suitable for you and your personal circumstances and if necessary, seek appropriate professional advice. All opinions, conclusions, forecasts or recommendations are reasonably held at the time of compilation but are subject to change without notice. Past performance is not an indication of future performance. Go Markets Pty Ltd, ABN 85 081 864 039, AFSL 254963 is a CFD issuer, and trading carries significant risks and is not suitable for everyone. You do not own or have any interest in the rights to the underlying assets. You should consider the appropriateness by reviewing our TMD, FSG, PDS and other CFD legal documents to ensure you understand the risks before you invest in CFDs. These documents are available here.
Next Article
Notice to clients – Scam websites warning
In this climate of phishing and scam websites and messages, we’d like to take this opportunity to remind our clients of the official GO Markets websites. Scammers at times will register similar domains, with minor spelling differences, and copy our website design in an attempt to deceive visitors. These copies can sometimes be very convincing....
January 31, 2023Read More >Previous Article
US Dollar Index Testing Key Level
US Dollar Fundamental Analysis Recent data indicated that the U.S. economy grew strongly in the fourth quarter which has boosted the Dollar against t...
January 31, 2023Read More >Please share your location to continue.
Check our help guide for more info.

- Trading

