- Trading
- Trading
- Markets
- Markets
- Products overview
- Forex
- Commodities
- Metals
- Indices
- Shares
- Cryptocurrencies
- Treasuries
- Platforms
- Platforms
- Platforms
- Platforms
- Platforms overview
- MetaTrader 4
- MetaTrader 5
- Education
- Education
- Education
- Education
- News & analysis
- Education Hub
- Economic calendar
- Help & support
- Help & support
- About
- Trading
- Trading
- Markets
- Markets
- Products overview
- Forex
- Commodities
- Metals
- Indices
- Shares
- Cryptocurrencies
- Treasuries
- Platforms
- Platforms
- Platforms
- Platforms
- Platforms overview
- MetaTrader 4
- MetaTrader 5
- Education
- Education
- Education
- Education
- News & analysis
- Education Hub
- Economic calendar
- Help & support
- Help & support
- About
- Home
- News & Analysis
- Economic Updates
- Amgen reports Q4 results
- 1 Month: -2.97%
- 3 Month: +5.75%
- Year-to-date: -0.64%
- 1 Year: -5.91%
News & AnalysisAmgen Inc. (AMGN) reported its fourth-quarter financial results after the closing bell on Monday.
The US biotechnology company reported total revenue of $6.846 billion (a 3% increase from the same period in 2020), just shy of the analyst forecast of $6.868 billion.
Earnings per share was reported at $4.36 (up 26% year-over-year), beating analyst forecasts of $4.04 per share.
Total revenues reported at $26 billion in 2021 – up by 2% from the previous year.
Robert A. Bradway, Chairman, and Chief Executive Officer of Amgen commented on last year’s results: “We realized strong volume growth for many of our key products during last year.”
“These products, combined with our many pipeline opportunities, position us well for long-term growth,” Bradway added.
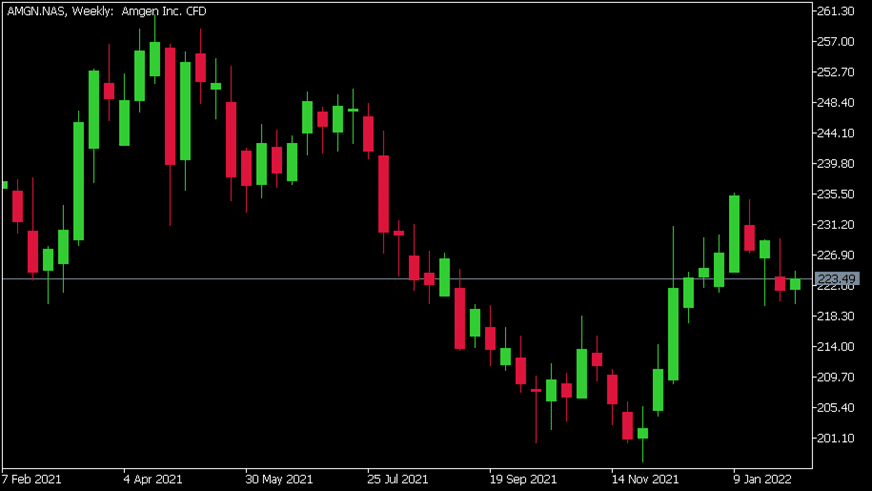
Amgen Inc. (AMGN) chart (Weekly)

Shares of Amgen little changed at the end of the trading day on Monday, up by 0.64% at $223.49 per share. Here is how the stock has performed in the past year –
Amgen is the 107th largest company in the World, with a total market cap of $125.90 billion.
You can trade Amgen Inc. (AMGN) and many other stocks from the NYSE, NASDAQ, HKEX, and the ASX with GO Markets as a Share CFD.
Sources: Amgen Inc., TradingView, GO Markets MT5, CompaniesMarketCap
The information provided is of general nature only and does not take into account your personal objectives, financial situations or needs. Before acting on any information provided, you should consider whether the information is suitable for you and your personal circumstances and if necessary, seek appropriate professional advice. All opinions, conclusions, forecasts or recommendations are reasonably held at the time of compilation but are subject to change without notice. Past performance is not an indication of future performance. Go Markets Pty Ltd, ABN 85 081 864 039, AFSL 254963 is a CFD issuer, and trading carries significant risks and is not suitable for everyone. You do not own or have any interest in the rights to the underlying assets. You should consider the appropriateness by reviewing our TMD, FSG, PDS and other CFD legal documents to ensure you understand the risks before you invest in CFDs. These documents are available here.
#Economy #Economics #Finance #MarketsNext Article
Identifying opportunities and managing risk with Autochartist
Autochartist's advanced chart pattern recognition can help you with identifying real-time trading opportunities and making more informed trading decisions. Founded in 2004, Autochartist is a financial market analytics company that leverages big data and proprietary technology to provide their services. They provide analytics for currencies, com...
February 8, 2022Read More >Previous Article
Share buybacks and Dividends. How do they compare?
As a shareholder of any company, you can be rewarded by that company in the form of share buybacks and dividend pay-outs. These actions would ofte...
February 7, 2022Read More >Please share your location to continue.
Check our help guide for more info.

- Trading

