- Trading
- Trading
- Markets
- Markets
- Products overview
- Forex
- Commodities
- Metals
- Indices
- Shares
- Cryptocurrencies
- Treasuries
- Platforms
- Platforms
- Platforms
- Platforms
- Platforms overview
- MetaTrader 4
- MetaTrader 5
- Education
- Education
- Education
- Education
- News & analysis
- Education Hub
- Economic calendar
- Help & support
- Help & support
- About
- Trading
- Trading
- Markets
- Markets
- Products overview
- Forex
- Commodities
- Metals
- Indices
- Shares
- Cryptocurrencies
- Treasuries
- Platforms
- Platforms
- Platforms
- Platforms
- Platforms overview
- MetaTrader 4
- MetaTrader 5
- Education
- Education
- Education
- Education
- News & analysis
- Education Hub
- Economic calendar
- Help & support
- Help & support
- About
- Home
- News & Analysis
- Economic Updates
- US stocks end slightly lower in a choppy session after hot PPI data and mixed FOMC minutes.
- Home
- News & Analysis
- Economic Updates
- US stocks end slightly lower in a choppy session after hot PPI data and mixed FOMC minutes.
 News & AnalysisNews & Analysis
US stocks end slightly lower in a choppy session after hot PPI data and mixed FOMC minutes.
13 October 2022 By Lachlan MeakinUS markets mostly tread water ahead of todays CPI figure, equities and the USD traded in a fairly tight range, a lack of expected chaos out of the UK and what were considered a mixed FOMC minutes saw markets in a holding pattern as traders await US inflation data.
Though a modest drop as compared to recent times, it still marked the 6th down day in a row for the S&P 500 and Nasdaq, with the S&P 500 now down over 25% from the highs, putting it well into bear market territory.
US PPI figures (Change in the price of finished goods and services sold by producers) came in at 0.4% for September, a steep rise from the previous month and handily surpassing analyst expectations of 0.2% showing that US inflation is sticking around and could bode for an elevated CPI figure later today.
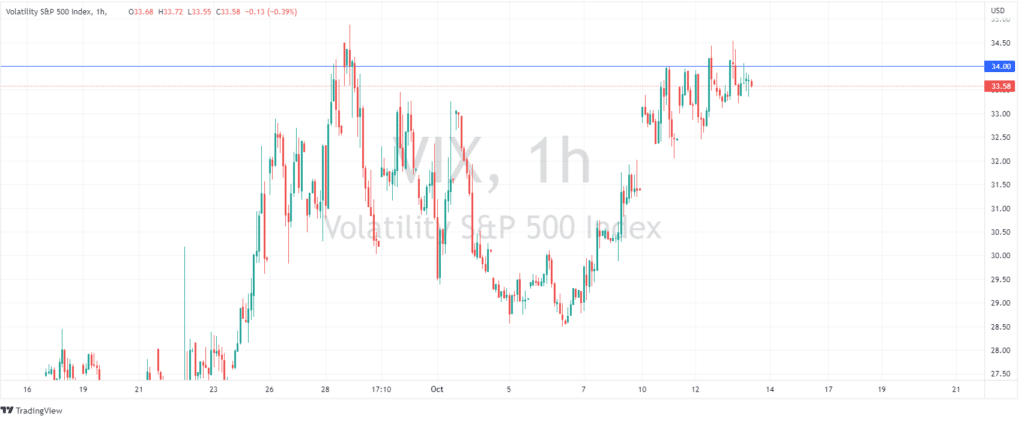
The VIX index (or fear index as it is sometimes known) was bid today, spiking back up above 34 to touch it’s highest reading this month as investors rushed to hedge themselves ahead of today’s CPI.
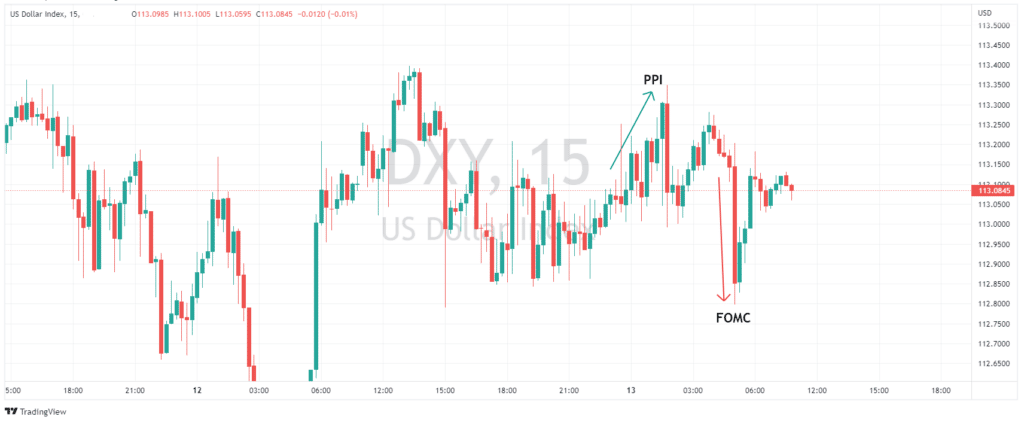
The USD had an initial rally on hot PPI figures, dipped on mixed FOMC minutes and managed to catch a bid to finish the day mostly unchanged for the day.
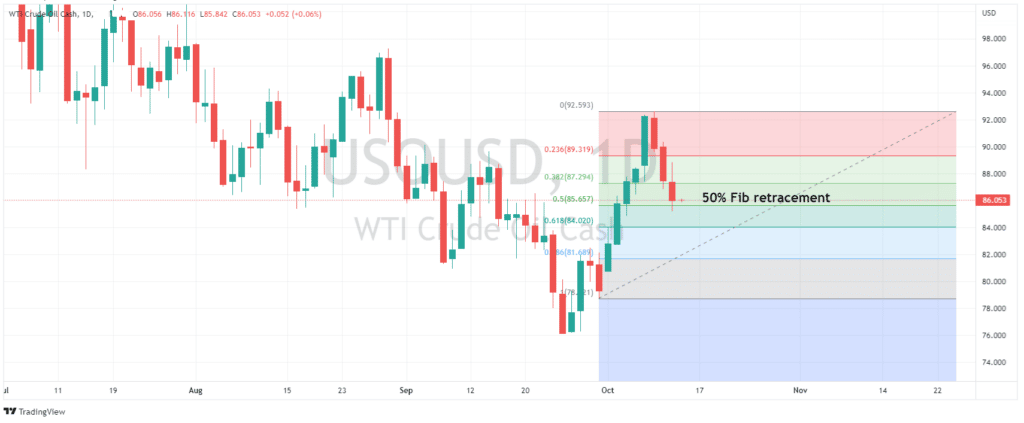
In commodities, Oil was down for 3rd straight day, finding support after hitting the 50% Fibonacci retracement of its October gains. This came on the back of growth concerns after a report from OPEC/EIA cutting global demand growth expectations.
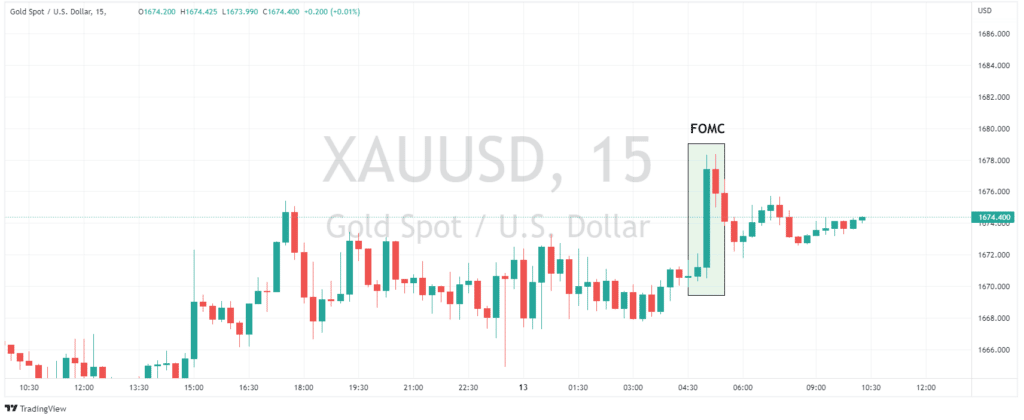
Gold climbed modestly for the day, rallying after the FOMC minutes but giving that spike back late in the session as the USD caught a bid.
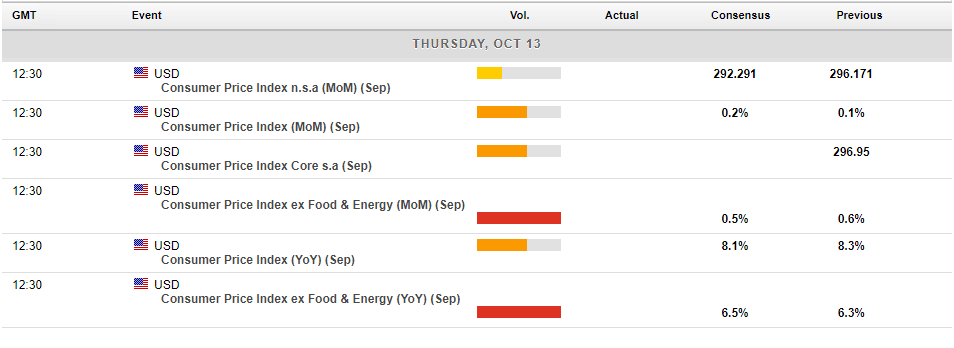
In economic announcements, all eyes will be on tonight’s US CPI figure. Analysts expects to see inflation increase 8.1% from a year ago in September. Anything above the prior reading of 8.3% should see a sharp decline in risk assets. On the flip side, a much softer reading may result in a sharp relief rally as markets re-price their Fed hiking predictions.
The information provided is of general nature only and does not take into account your personal objectives, financial situations or needs. Before acting on any information provided, you should consider whether the information is suitable for you and your personal circumstances and if necessary, seek appropriate professional advice. All opinions, conclusions, forecasts or recommendations are reasonably held at the time of compilation but are subject to change without notice. Past performance is not an indication of future performance. Go Markets Pty Ltd, ABN 85 081 864 039, AFSL 254963 is a CFD issuer, and trading carries significant risks and is not suitable for everyone. You do not own or have any interest in the rights to the underlying assets. You should consider the appropriateness by reviewing our TMD, FSG, PDS and other CFD legal documents to ensure you understand the risks before you invest in CFDs. These documents are available here.
#Economy #Economics #Finance #MarketsNext Article
How to maximise your trading strategy using Relative Volume?
For new traders, it can be difficult to know which indicators to use, the saturation of various moving averages, RSI’s, MACD’s and more can be overwhelming and counterproductive. However, utilising relative volume, as an indicator is one of the most important sources of information for technical traders. What is Volume? Vo...
October 13, 2022Read More >Previous Article
Bank of England gives Funds three days to get books in order
The Bank of England has seemingly turned its back on protecting UK Retirement funds, after initially bailing out these funds who were facing serious l...
October 12, 2022Read More >Please share your location to continue.
Check our help guide for more info.

- Trading
