- Trading
- Trading
- Markets
- Markets
- Products overview
- Forex
- Commodities
- Metals
- Indices
- Shares
- Cryptocurrencies
- Treasuries
- Platforms
- Platforms
- Platforms
- Platforms
- Platforms overview
- MetaTrader 4
- MetaTrader 5
- Education
- Education
- Education
- Education
- News & analysis
- Education Hub
- Economic calendar
- Help & support
- Help & support
- About
- Trading
- Trading
- Markets
- Markets
- Products overview
- Forex
- Commodities
- Metals
- Indices
- Shares
- Cryptocurrencies
- Treasuries
- Platforms
- Platforms
- Platforms
- Platforms
- Platforms overview
- MetaTrader 4
- MetaTrader 5
- Education
- Education
- Education
- Education
- News & analysis
- Education Hub
- Economic calendar
- Help & support
- Help & support
- About
- Home
- News & Analysis
- Articles
- Economic Updates
- USDJPY provides potential trade after holding a key Fibonacci level
- Home
- News & Analysis
- Articles
- Economic Updates
- USDJPY provides potential trade after holding a key Fibonacci level
 News & AnalysisNews & Analysis
USDJPY provides potential trade after holding a key Fibonacci level
12 August 2022 By GO MarketsThe USDJPY has been in an extremely strong upward trend since September 2021. This pair’s recent price action has also been charactarised by relatively weak retracements as it has trended higher. Inflationary pressures have acted as a strong catalyst for the USD against most other currencies further aided by the Federal Reserve taking a strong stance against inflation with a series of aggressive interest rate hikes. At the same time, the JPY has remained weak as the Central Bank of Japan has refused to intervene and shift from its dovish stance.
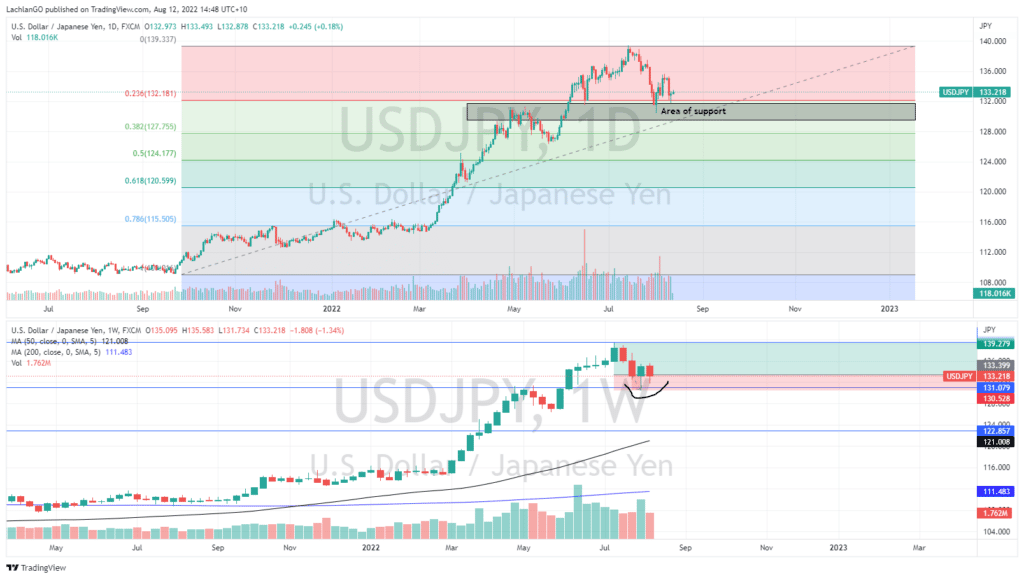
The most recent retracement shows the potential for a good risk/reward Long trade. On the chart, it can be seen that the price has pulled back to the 23.60% Fibonacci level, which is at 132/133JPY. This area also doubles as a support zone with the prior resistance level becoming a level of support which is another sign that the trend may continue.
On the weekly chart, the characteristics of the candlesticks near the support zone also support the premise that the price may bounce. The candles have long wicks touching the support area indicating that the buyers are soaking up the supply. They have also closed near their opening price again showing how buyers are soaking up the supply.

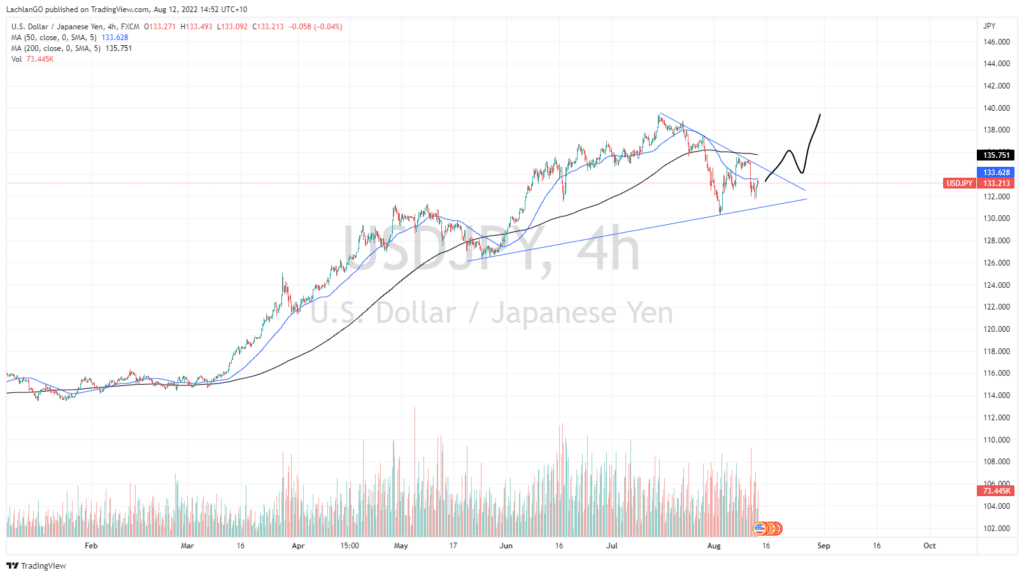
The 4-hour chart shows a consolidation of the price forming a triangle, with the potential to break out to the upside. This may provide an alternative entry signal for the same overall strategy. An important aspect to remember when trading this strategy is to ensure that price occurs with relatively high volume. Large volume indicates that buyers are regaining control over the price, and that sellers have become exhausted.

Potential risks
There are some risks with this trade. Firstly, the pair is already quite overextended with the price at multi-decade highs. In addition, with US inflation fears potentially easing and interest rate hikes priced in already, the current price may be near its peak.
The information provided is of general nature only and does not take into account your personal objectives, financial situations or needs. Before acting on any information provided, you should consider whether the information is suitable for you and your personal circumstances and if necessary, seek appropriate professional advice. All opinions, conclusions, forecasts or recommendations are reasonably held at the time of compilation but are subject to change without notice. Past performance is not an indication of future performance. Go Markets Pty Ltd, ABN 85 081 864 039, AFSL 254963 is a CFD issuer, and trading carries significant risks and is not suitable for everyone. You do not own or have any interest in the rights to the underlying assets. You should consider the appropriateness by reviewing our TMD, FSG, PDS and other CFD legal documents to ensure you understand the risks before you invest in CFDs. These documents are available here.
#Economy #Economics #Finance #MarketsNext Article
The week ahead –RBNZ, RBA and FOMC in the spotlight and set to drive the AUD, NZD and USD
US equity markets finished off the week with a blockbuster of a session, pushing all the major indices to a 4th straight week of gains with the growth heavy Russell 2000 (+4.93%) outperforming the “Value” Dow (+2.92%) hammering home that risk on was the overriding narrative of the week. This was the first time since November 2021 that the br...
August 15, 2022Read More >Previous Article
US stocks give up early gains as bulls fail to hold key support and yields rise
US indexes finished mixed with early gains on a post CPI honeymoon and a soft PPI were erased during the session as investors realised they may have b...
August 12, 2022Read More >Please share your location to continue.
Check our help guide for more info.

- Trading
