- Trading
- Trading
- Markets
- Markets
- Products overview
- Forex
- Commodities
- Metals
- Indices
- Shares
- Cryptocurrencies
- Treasuries
- Platforms
- Platforms
- Platforms
- Platforms
- Platforms overview
- MetaTrader 4
- MetaTrader 5
- Education
- Education
- Education
- Education
- News & analysis
- Education Hub
- Economic calendar
- Help & support
- Help & support
- About
- Trading
- Trading
- Markets
- Markets
- Products overview
- Forex
- Commodities
- Metals
- Indices
- Shares
- Cryptocurrencies
- Treasuries
- Platforms
- Platforms
- Platforms
- Platforms
- Platforms overview
- MetaTrader 4
- MetaTrader 5
- Education
- Education
- Education
- Education
- News & analysis
- Education Hub
- Economic calendar
- Help & support
- Help & support
- About
- Home
- News & Analysis
- Articles
- Featured
- Gold technical and fundamental analysis – How to trade it’s recent price action
- Home
- News & Analysis
- Articles
- Featured
- Gold technical and fundamental analysis – How to trade it’s recent price action
 News & AnalysisNews & Analysis
Gold technical and fundamental analysis – How to trade it’s recent price action
20 April 2023 By Lachlan MeakinGold has been one of the most popular and highly traded markets recently as price action in the precious metal has really come alive, rate hikes, the war in Ukraine and Bank Crises have all played a part in the fundamental reasons for gold price movements in the last 12 months. Let’s take a look at the chart to see these fundamental effects and how the technical are shaping up.
Firstly, the macro picture of what fundamentals have done to the price of Gold are where it’s turning points have been.
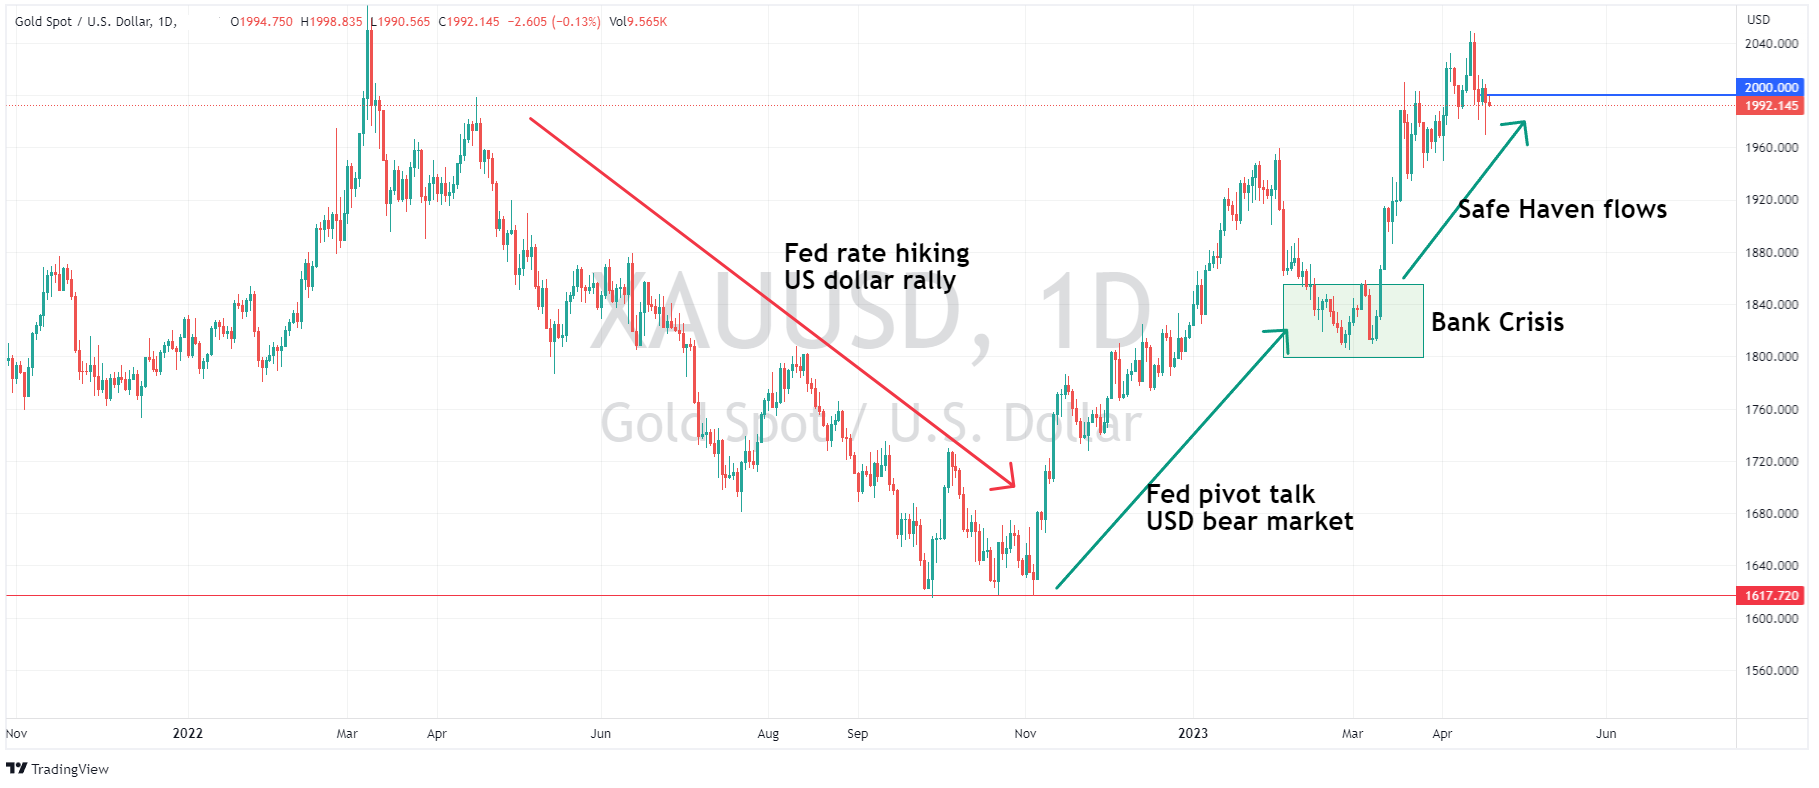
The chart below shows the decline in the Gold Price during most of 2022 as the USD rallied strongly on the back of an aggressive Federal Reserve hiking cycle, this put downward pressure on gold where we can see it bottomed and found support around the 1617 level. Next was the talk of a Fed pivot, the market starting to price in the end of the Fed hiking cycle and a subsequent bear market in the USD which lifted Gold prices. After this mov retraced in Feb/Mar we then had the collapses of Signature bank and Credit Suisse, this saw the dynamics of Gold change from following interest rates and USD strength to being a bona fide safe haven and an explosive move up to where we are now, looking to test the all-time highs set back in 2020.

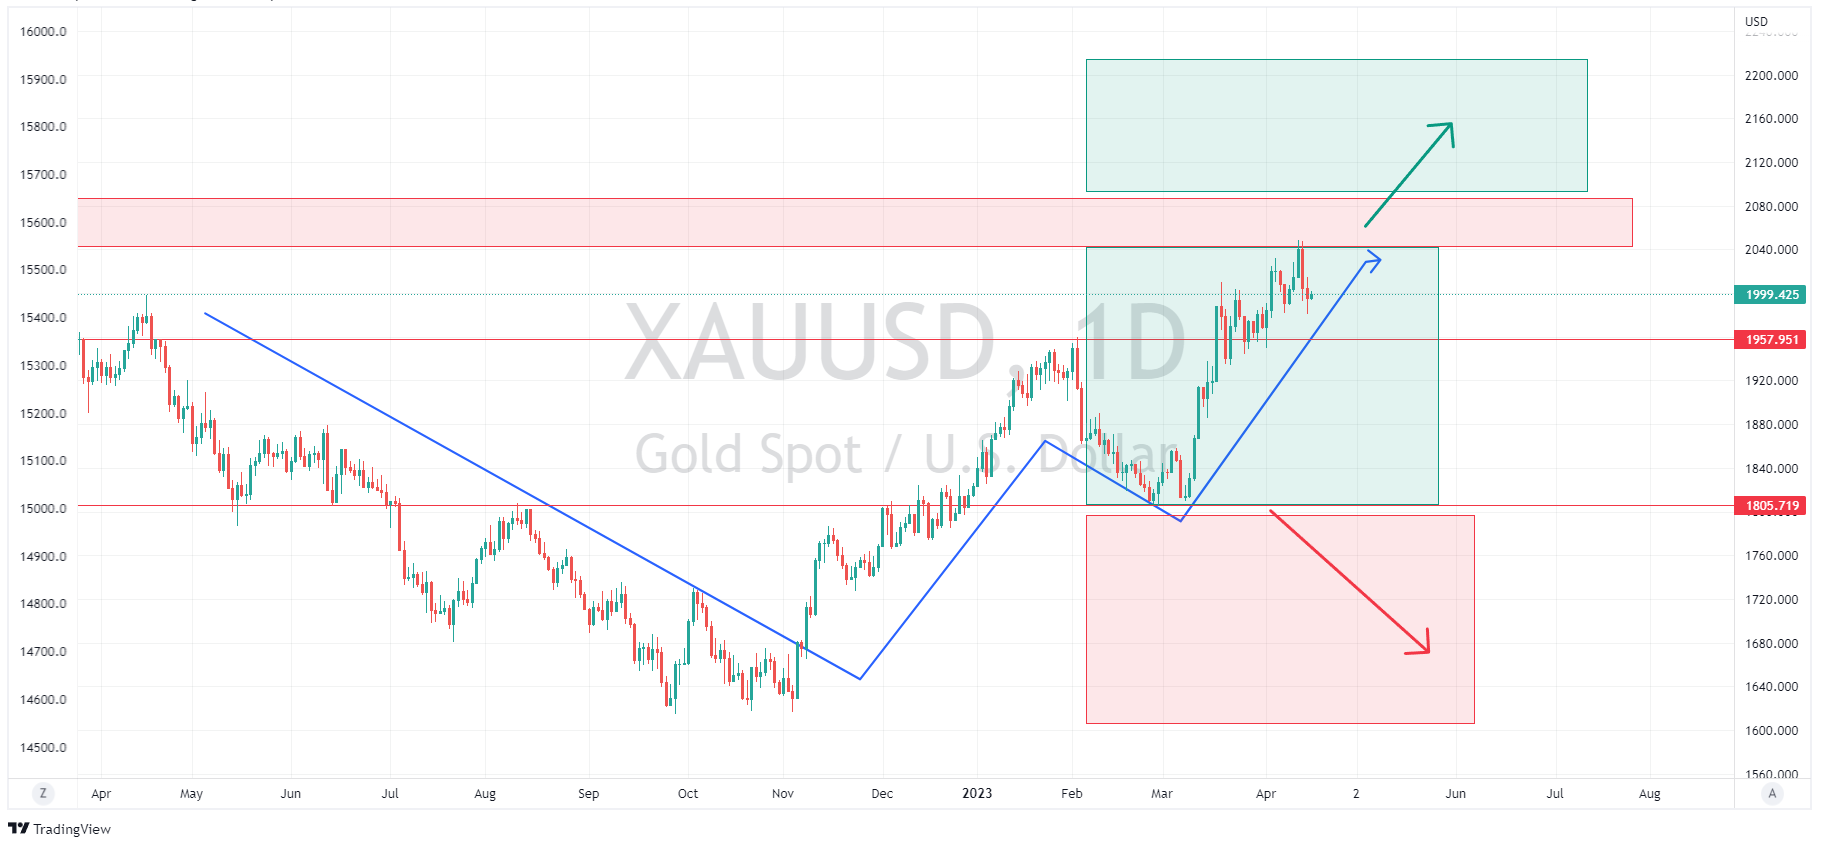
Zooming in on the technical, I believe Gold is still in a strong uptrend and will continue to benefit from safe haven flows while the left-over worries of the banking crisis still remain (is it really over?) but saying that it will find tough going above 2040 USD an ounce, as we can see from the forceful rejection at that price last week, without a further catalyst to push it though, such as another leg to the bank crisis or escalation in geopolitics events.
The other Key level is 1805, the last swing low which can be seen as major support. If you believe the Gold bull story the way to play the long side is to avoid getting long above 2020 until a confirmed break of this major resistance level is confirmed and legging into longs everywhere above 1805, a break of that major support level would see the bears certainly in charge.
If you’re a Gold bear, Use the major resistance at 2020-2040 to your advantage, getting short and using that area as an exit if a confirmed break to the upside occurs.

The information provided is of general nature only and does not take into account your personal objectives, financial situations or needs. Before acting on any information provided, you should consider whether the information is suitable for you and your personal circumstances and if necessary, seek appropriate professional advice. All opinions, conclusions, forecasts or recommendations are reasonably held at the time of compilation but are subject to change without notice. Past performance is not an indication of future performance. Go Markets Pty Ltd, ABN 85 081 864 039, AFSL 254963 is a CFD issuer, and trading carries significant risks and is not suitable for everyone. You do not own or have any interest in the rights to the underlying assets. You should consider the appropriateness by reviewing our TMD, FSG, PDS and other CFD legal documents to ensure you understand the risks before you invest in CFDs. These documents are available here.
Next Article
American Express posts mixed results, sets a new quarterly record
American Express Company (NYSE: AXP) announced first quarter financial results before the market open on Thursday, setting a new quarterly revenue record. Company overview Founded: March 18, 1850 Headquarters: New York, United States Number of employees: 77,300 (December 2022) Industry: Banking, financial services Key people: St...
April 21, 2023Read More >Previous Article
US Stocks finish mixed in choppy session after Hot UK CPI spooks the markets
Major US indexes finished mixed in a choppy session for equities and FX after a hotter than expected re-ignited inflation fears and a global hawkish r...
April 20, 2023Read More >Please share your location to continue.
Check our help guide for more info.

- Trading
