- Trading
- Trading
- Markets
- Markets
- Products overview
- Forex
- Commodities
- Metals
- Indices
- Shares
- Cryptocurrencies
- Treasuries
- Platforms
- Platforms
- Platforms
- Platforms
- Platforms overview
- MetaTrader 4
- MetaTrader 5
- Education
- Education
- Education
- Education
- News & analysis
- Education Hub
- Economic calendar
- Help & support
- Help & support
- About
- Trading
- Trading
- Markets
- Markets
- Products overview
- Forex
- Commodities
- Metals
- Indices
- Shares
- Cryptocurrencies
- Treasuries
- Platforms
- Platforms
- Platforms
- Platforms
- Platforms overview
- MetaTrader 4
- MetaTrader 5
- Education
- Education
- Education
- Education
- News & analysis
- Education Hub
- Economic calendar
- Help & support
- Help & support
- About
- Home
- News & Analysis
- Forex
- August No Ordinary Month For GBPJPY
News & AnalysisAs Brexit concerns continue to weigh heavy on Pound Sterling crosses, there’s not much to discuss from a technical perspective. Evidence of an overall bearishness sentiment dominates the charts with a few corrective moves thrown in for good measure.
However, sifting through the layers of Sterling sameness, I uncovered something interesting relating to the GBPJPY, which might provide some trading opportunities longer-term.
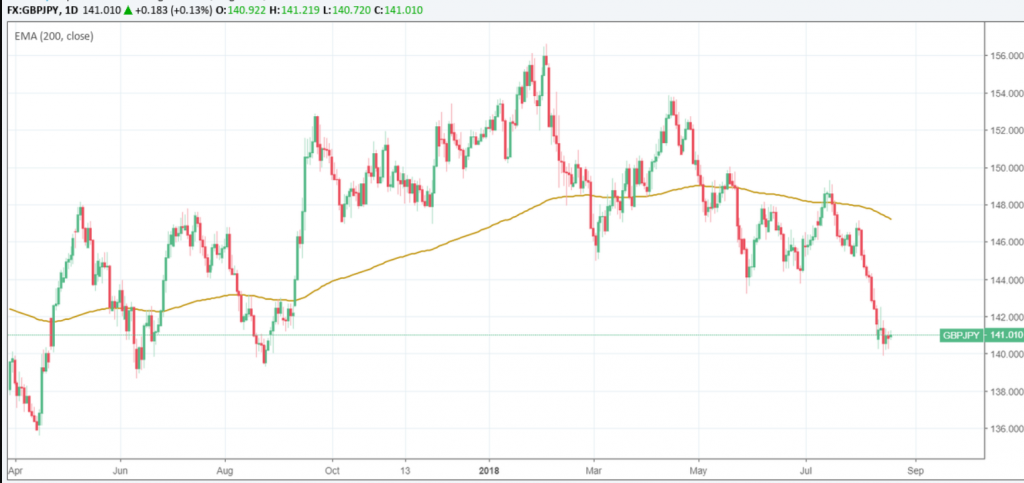
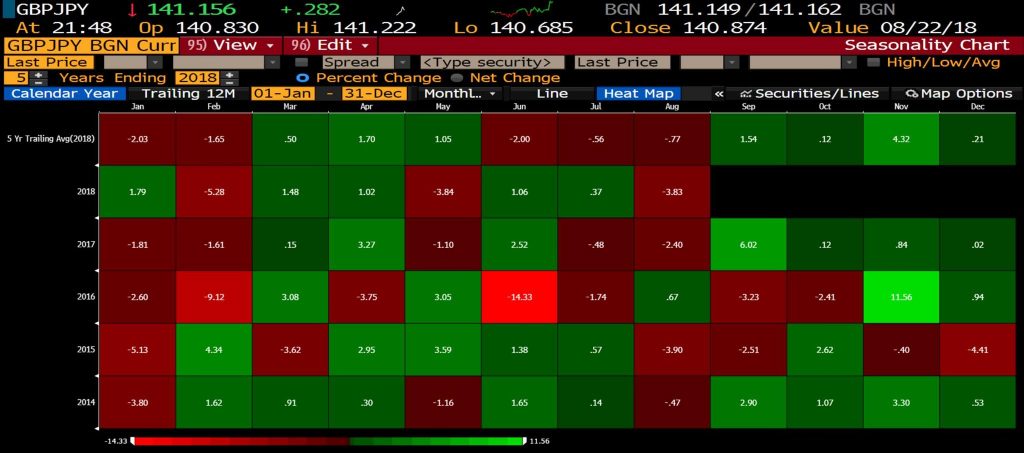
First, taking a look at a daily chart above, notice we are hovering around the same price region as we were in August last year. Could this mean the pair is due for a change in direction? Perhaps. What I find more intriguing is that for the past five years, August has been predominantly bearish for the GBPJPY pair when compared to other months. This seasonality chart from Bloomberg shows this more clearly.
So how does this relate to longer-term trading opportunities?
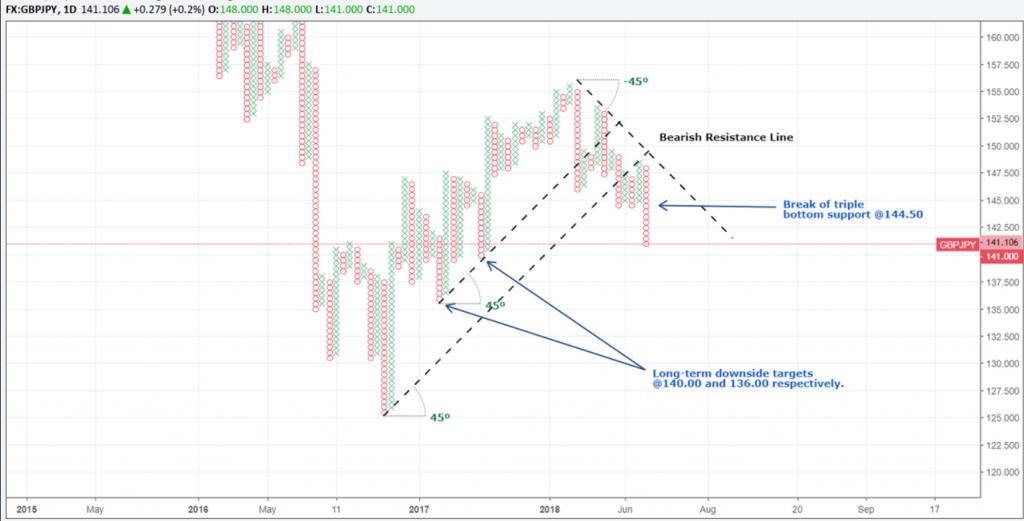
If we are to believe that August is typically a bearish month, then we would be naturally inclined to seek short trades, and according to the point and figure chart below, I think I may have found one. Keep in mind that the seasonality data also suggests recoveries into December so we would need to trade with care.
The bearish resistance line suggests we are currently in a downtrend with an increase in supply triggering a bearish trade signal as the price broke through the triple bottom support at 144.50.
At present, I am watching two downside targets should the fall in price exacerbate. These levels are located at 140.00 and 136.00 respectively. Alternatively, any upside move will need to re-test the 144.50 area which should act as resistance and also a rally above 146.00 to consider revising the overall trend.
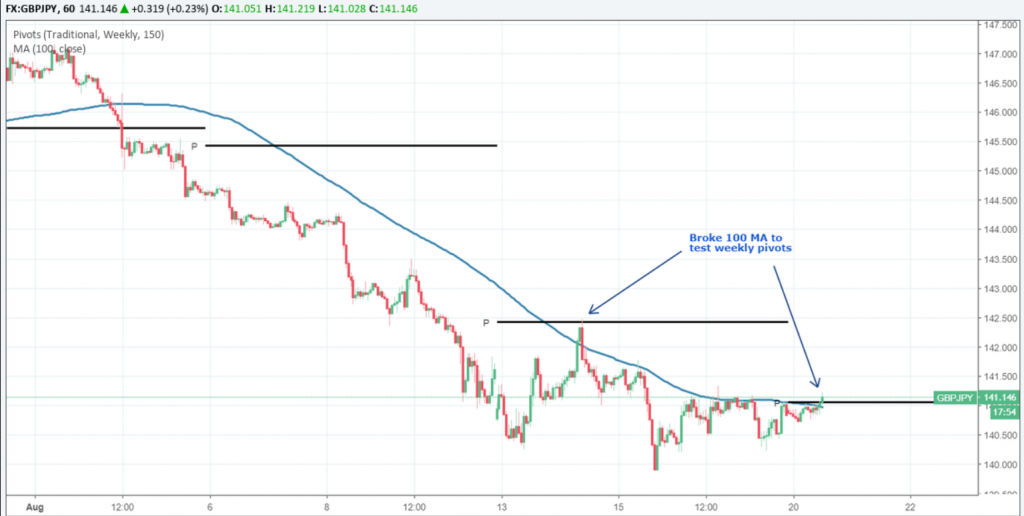
Finally, if we study the short-term price action above on the hourly chart, it would seem the 100 Day Moving Average line in blue is helping to cap any bullish activity. The only time it has successfully managed to punch above the 100 MA this month has been to test the weekly pivot lines in black.
If you are interested in other GBP analysis, I recently posted an article on GBPAUD here which I believe is another potential long-term opportunity. For both these ideas, much will depend on Brexit certainty and how global trade talks progress in the coming weeks.
By Adam Taylor CFTe
This article is written by a GO Markets Analyst and is based on their independent analysis. They remain fully responsible for the views expressed as well as any remaining error or omissions. Trading Forex and Derivatives carries a high level of risk.
Sources: Tradingview, BloombergThe information provided is of general nature only and does not take into account your personal objectives, financial situations or needs. Before acting on any information provided, you should consider whether the information is suitable for you and your personal circumstances and if necessary, seek appropriate professional advice. All opinions, conclusions, forecasts or recommendations are reasonably held at the time of compilation but are subject to change without notice. Past performance is not an indication of future performance. Go Markets Pty Ltd, ABN 85 081 864 039, AFSL 254963 is a CFD issuer, and trading carries significant risks and is not suitable for everyone. You do not own or have any interest in the rights to the underlying assets. You should consider the appropriateness by reviewing our TMD, FSG, PDS and other CFD legal documents to ensure you understand the risks before you invest in CFDs. These documents are available here.
#Forex #ForexAnalysis #ForexBroker #ForexCharts #ForexMarket #ForexNews #ForexSignal #ForexTradingNext Article
Greece’s Bailout Comes to an End – A Goodbye to the Troika
After eight long years of crisis whereby Greece endured stringent budget austerity programs, the country’s bailout will finally come to an end. Greece will therefore have to finance itself by borrowing on international bond markets. Before the bailout Greece was battling massive debt, loss of investment and huge unemployment. Nearly €300b...
August 21, 2018Read More >Previous Article
Warning Signs Of An Economic Storm Front
In Economics, the difference between 10 Year and 2 Year Bond Yields is one of the leading indicators that help investors to observe any significant ch...
August 17, 2018Read More >Please share your location to continue.
Check our help guide for more info.

- Trading


