- Trading
- Trading
- Markets
- Markets
- Products overview
- Forex
- Commodities
- Metals
- Indices
- Shares
- Cryptocurrencies
- Treasuries
- Platforms
- Platforms
- Platforms
- Platforms
- Platforms overview
- MetaTrader 4
- MetaTrader 5
- Education
- Education
- Education
- Education
- News & analysis
- Education Hub
- Economic calendar
- Help & support
- Help & support
- About
- Trading
- Trading
- Markets
- Markets
- Products overview
- Forex
- Commodities
- Metals
- Indices
- Shares
- Cryptocurrencies
- Treasuries
- Platforms
- Platforms
- Platforms
- Platforms
- Platforms overview
- MetaTrader 4
- MetaTrader 5
- Education
- Education
- Education
- Education
- News & analysis
- Education Hub
- Economic calendar
- Help & support
- Help & support
- About
- Home
- News & Analysis
- Forex
- NZDJPY showing a potential buy?
News & AnalysisThe NZDJPY like most currencies against the JPY has been in a strong uptrend for over 2 years. With the Central Bank of Japan remaining dovish in its monetary policy the currency has taken a beating against most other currencies and as other Central Banks have acted against rising inflation.
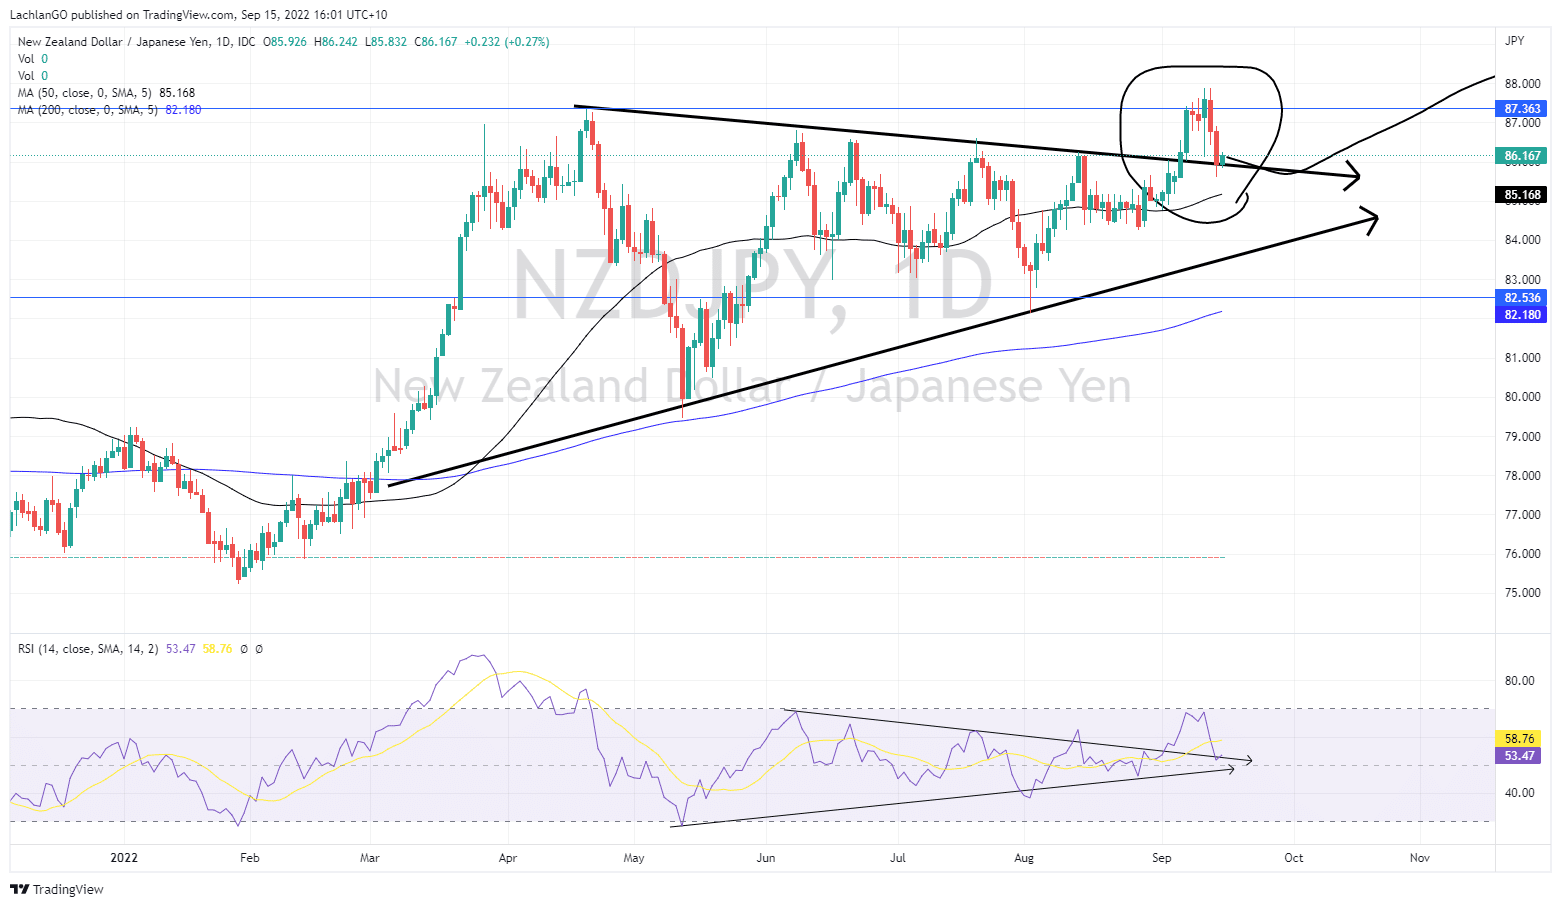
The NZD has been able to take advantage of the JPY weakness and consolidate into a large symmetrical triangle. The price recently broke out of the triangle to the upside before failing to push through the next resistance point at 87.350 JPY and falling back down. This was in part due to the hot inflation figures that came from the USA. With CPI and core CPI figures being higher than expected the risk on currencies like the AUD and the NZD both dropped as the market looked to move their money into safer assets. The drop was seen most clearly against the USD in which the NZD fell to 26-month lows.
New Zealand also just announced their q/q GDP figures showing very strong result with a 1.7% increase for the quarter, which was 0.7% higher than what was expected, and 1.8% higher than the prior period. The price of the NZDJPY initially spiked up on the announcement although since then it has been a tight consolidation.
Technicals
As discussed above, the price failed to break above the 87.35 resistance point and subsequently sold back down. However, it has not yet breached the triangle to the downside and may just be a fake out. The RSI also mirrors the breakout with the tight consolidation of the RSI before a spike to the upside. With the price attempting to reach decade highs a fake out/ retracement is not particularly unexpected.
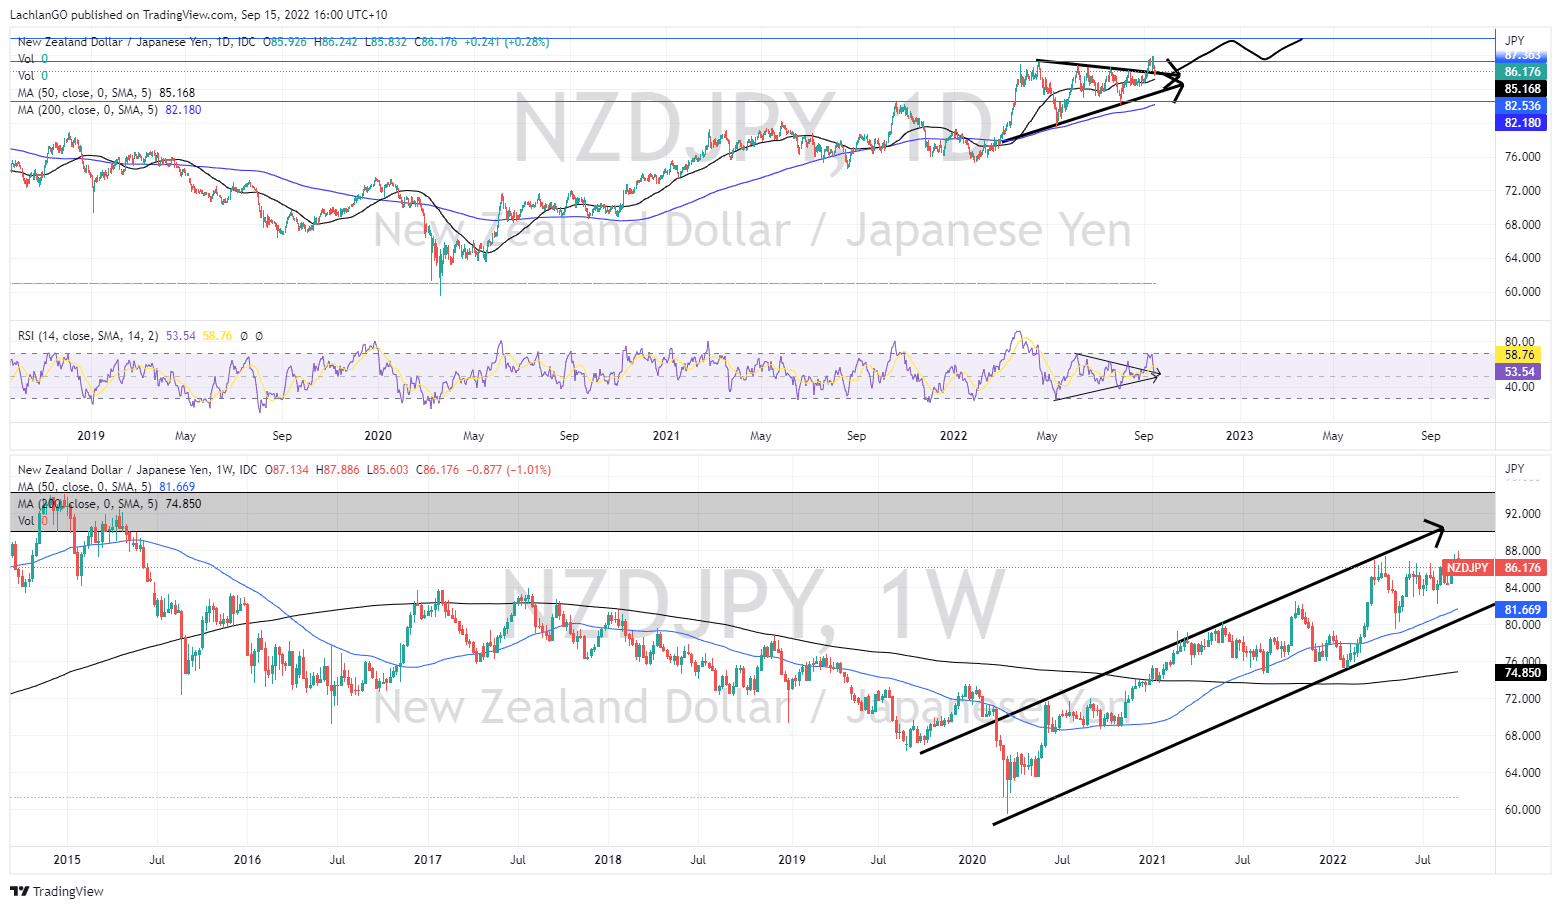
As shown in the chart, it is possible, the price action will retest the resistance point before breaking higher. The next resistance point after if the breakout does occur will be 90.00 JPY. However, this area is a relatively heavy supply zones as seen on the weekly chart. The weekly chart also indicates a long term upward trending channel, which provides more support for a continuation of the upward move.


Shifts in the Bank of Japan’s monetary policy may negatively impact this trade. At this stage they have been unwilling to change their dovish stance, however if they were to increase interest rates, a shift may occur and likely very quickly, therefore some caution is needed.
The information provided is of general nature only and does not take into account your personal objectives, financial situations or needs. Before acting on any information provided, you should consider whether the information is suitable for you and your personal circumstances and if necessary, seek appropriate professional advice. All opinions, conclusions, forecasts or recommendations are reasonably held at the time of compilation but are subject to change without notice. Past performance is not an indication of future performance. Go Markets Pty Ltd, ABN 85 081 864 039, AFSL 254963 is a CFD issuer, and trading carries significant risks and is not suitable for everyone. You do not own or have any interest in the rights to the underlying assets. You should consider the appropriateness by reviewing our TMD, FSG, PDS and other CFD legal documents to ensure you understand the risks before you invest in CFDs. These documents are available here.
#Forex #ForexAnalysis #ForexBroker #ForexCharts #ForexMarket #ForexNews #ForexSignal #ForexTradingNext Article
Adobe announces latest results and Figma acquisition
Adobe Inc. (ADBE) announced its financial results for the third quarter of the fiscal year 2022 before the opening bell in the US on Thursday. The American software company reported revenue of $4.433 billion, falling slightly short of Wall Street forecast of $4.438 billion. Earnings per share reported at $3.40 per share for the quarter, above...
September 16, 2022Read More >Previous Article
Market smashed as CPI figures comes in hotter than expected
The US market has been smashed overnight on the back of higher then expected inflation figures. There had been some hope that inflation pressure was e...
September 14, 2022Read More >Please share your location to continue.
Check our help guide for more info.

- Trading

