- Trading
- Trading
- Markets
- Markets
- Products overview
- Forex
- Commodities
- Metals
- Indices
- Shares
- Cryptocurrencies
- Treasuries
- Platforms
- Platforms
- Platforms
- Platforms
- Platforms overview
- MetaTrader 4
- MetaTrader 5
- Education
- Education
- Education
- Education
- News & analysis
- Education Hub
- Economic calendar
- Help & support
- Help & support
- About
- Trading
- Trading
- Markets
- Markets
- Products overview
- Forex
- Commodities
- Metals
- Indices
- Shares
- Cryptocurrencies
- Treasuries
- Platforms
- Platforms
- Platforms
- Platforms
- Platforms overview
- MetaTrader 4
- MetaTrader 5
- Education
- Education
- Education
- Education
- News & analysis
- Education Hub
- Economic calendar
- Help & support
- Help & support
- About
- Home
- News & Analysis
- Articles
- Forex
- Snapshot – AUDNZD, EURUSD, USOIL
News & AnalysisAUDNZD – Point & Figure Chart
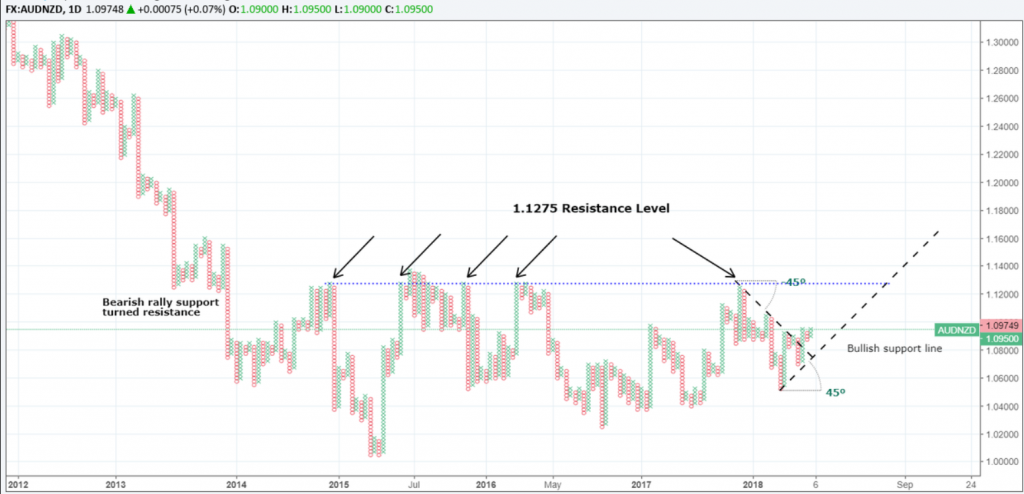
AUDNZD – As we approach the upcoming policy meetings this week, the expectations for both central banks (RBA and the RBNZ) is to keep their respective interest rates on hold. The only difference is that the New Zealand camp appears to be more dovish concerning fiscal policy going forward. We could also mention the slight boost in commodity prices which has helped the Australian economy, while the Kiwis struggle with softening dairy prices. It’s these subtle differences that could be translating into a stronger Australian Dollar on the technicals against its counterpart.
The Point and Figure chart above confirms the critical resistance level of 1.1250/75 within the longer-term range. Notice price has tested the area five times previously and continues to be a formidable barrier to the upside.
At present, the price is trading around 1.0970 levels and has formed a double top at 1.0950. We will be looking for a close above 1.0975 for a potential buy signal and perhaps the next leg up towards the 1.12 region. Also, despite the sideways action, we are technically in an uptrend as per the bullish support line displayed on the chart.
A move below 1.08 would suggest a change in the overall trend and a possible step towards the recent low of 1.0525.
RBA Rate Decision – Tuesday 14:30 pm Sydney/Melb time.
RBNZ Rate Decision – Thursday 07:00 am Sydney/Melb time.
EURUSD – Daily Ichimoku
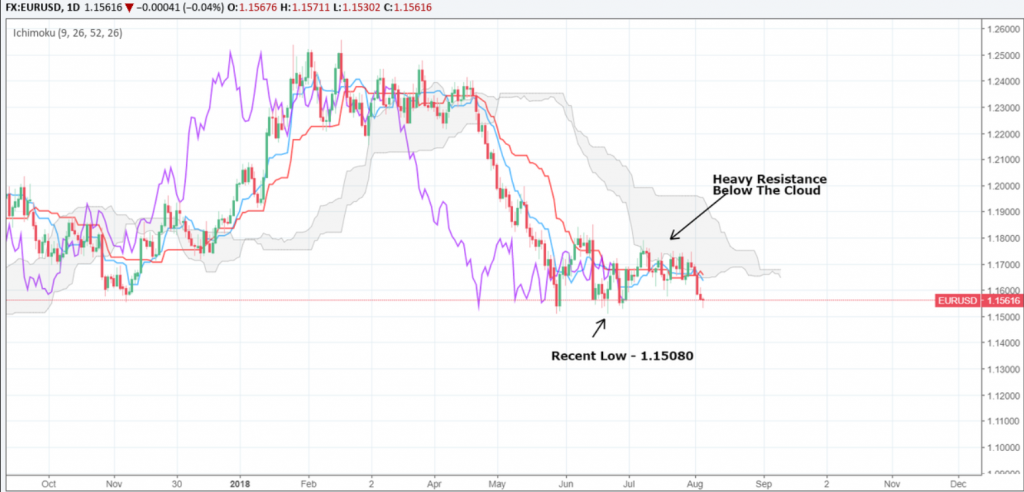
EURUSD – We took a look at this pair last week on the daily Ichimoku chart, and price action has mostly followed my expectations in this case. To refresh your memory, I’ll leave a link below. Remember, we discussed the potential resistance within the cloud, and as you can see, the price failed to breach this area and is now looking like it may re-test that low of 1.15080. Longer-term, I am still bullish on the pair, but still waiting to see a close above the weekly 200 day moving average. Finally, the thinning of the cloud just below the 1.17 region presents an opportunity for the bulls if there becomes less resistance. We’ll have to wait and see on this one.
Last weeks EURUSD analysis – here
USOOIL – Daily Chart
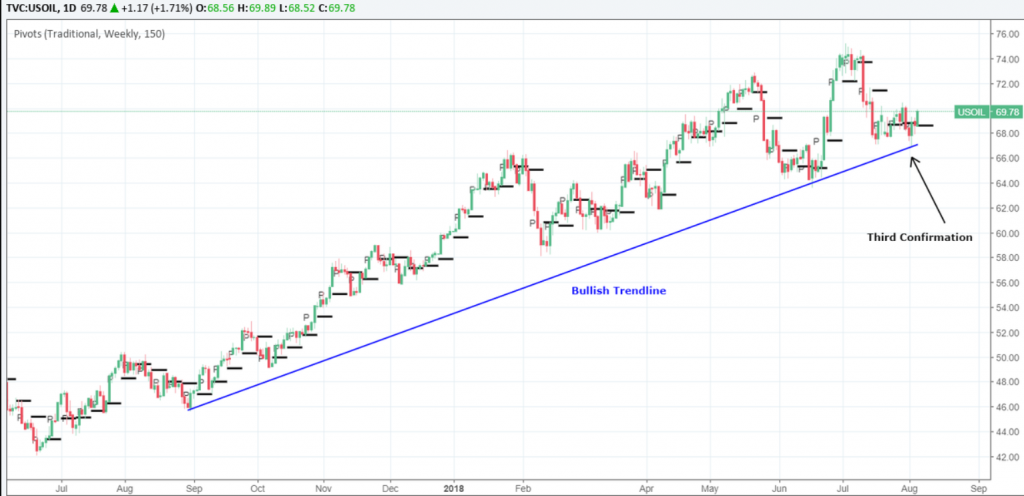
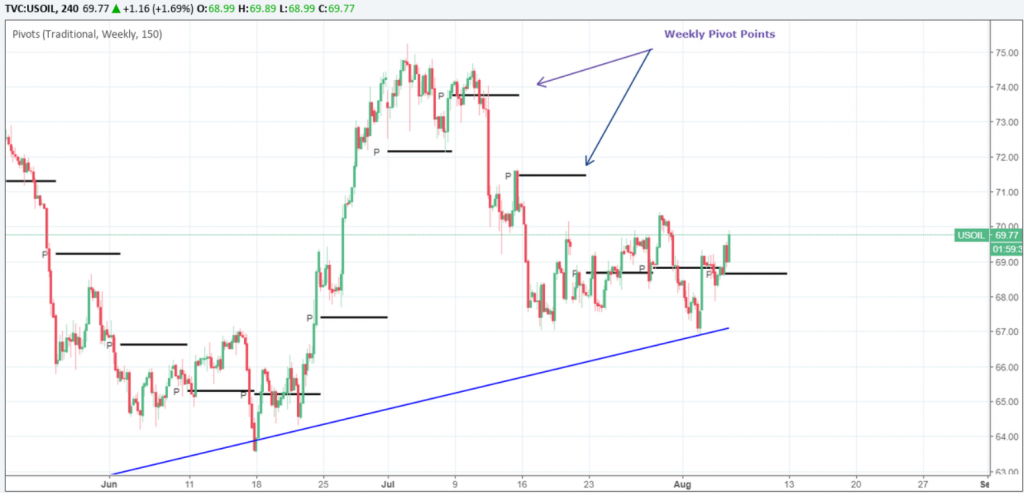
USOIL – Similar to EURUSD, I wanted to do a quick recap of last weeks snapshot analysis as we have seen significant development. I mentioned the longer-term bullish trendline forming and waiting for the third touch. Over the past few days, we have witnessed this price action confirming the uptrend as the price re-tested the trendline in blue and resumed course. At this stage, I am still eyeing the 72.00 and 74.00 levels which coincide with the weekly pivot points as potential targets for oil.
Below is the same chart viewed on a four-hour time frame to provide a clearer picture of these weekly pivot points.
You can also compare last week’s oil chart here to see how price action unfolded.
By Adam Taylor CFTe
This article is written by a GO Markets Analyst and is based on their independent analysis. They remain fully responsible for the views expressed as well as any remaining error or omissions. Trading Forex and Derivatives carries a high level of risk. For more on trading Forex check out our Forex Trading Education Centre, MetaTrader 4 Tutorials, or open a free MetaTrader 4 demo account.
Sources: MT4 Metatrader, TradingviewThe information provided is of general nature only and does not take into account your personal objectives, financial situations or needs. Before acting on any information provided, you should consider whether the information is suitable for you and your personal circumstances and if necessary, seek appropriate professional advice. All opinions, conclusions, forecasts or recommendations are reasonably held at the time of compilation but are subject to change without notice. Past performance is not an indication of future performance. Go Markets Pty Ltd, ABN 85 081 864 039, AFSL 254963 is a CFD issuer, and trading carries significant risks and is not suitable for everyone. You do not own or have any interest in the rights to the underlying assets. You should consider the appropriateness by reviewing our TMD, FSG, PDS and other CFD legal documents to ensure you understand the risks before you invest in CFDs. These documents are available here.
#Forex #ForexAnalysis #ForexBroker #ForexCharts #ForexMarket #ForexNews #ForexSignal #ForexTradingNext Article
Are the bond markets overwhelming or intimidating?
By Deepta Bolaky The intermarket relationships between commodities, currency, equity and bond markets are key in understanding the way the markets interact and move. Some markets will move with each other while others will move against each other. There are different types of bonds but for the purpose of this article, we will use the U.S Treas...
August 7, 2018Read More >Previous Article
Bullish Technical Reversal Trend
By Deepta Bolaky “Buy the Dips” and “Sell the Rallies” are widely followed strategies by new or experienced traders. Buy-the-dip strateg...
July 31, 2018Read More >Please share your location to continue.
Check our help guide for more info.

- Trading


