- Trading
- Trading
- Markets
- Markets
- Products overview
- Forex
- Commodities
- Metals
- Indices
- Shares
- Cryptocurrencies
- Treasuries
- Platforms
- Platforms
- Platforms
- Platforms
- Platforms overview
- MetaTrader 4
- MetaTrader 5
- Education
- Education
- Education
- Education
- News & analysis
- Education Hub
- Economic calendar
- Help & support
- Help & support
- About
- Trading
- Trading
- Markets
- Markets
- Products overview
- Forex
- Commodities
- Metals
- Indices
- Shares
- Cryptocurrencies
- Treasuries
- Platforms
- Platforms
- Platforms
- Platforms
- Platforms overview
- MetaTrader 4
- MetaTrader 5
- Education
- Education
- Education
- Education
- News & analysis
- Education Hub
- Economic calendar
- Help & support
- Help & support
- About
- Home
- News & Analysis
- Oil, Metals, Soft Commodities
- Brent testing critical level again
- Home
- News & Analysis
- Oil, Metals, Soft Commodities
- Brent testing critical level again
 News & AnalysisNews & Analysis
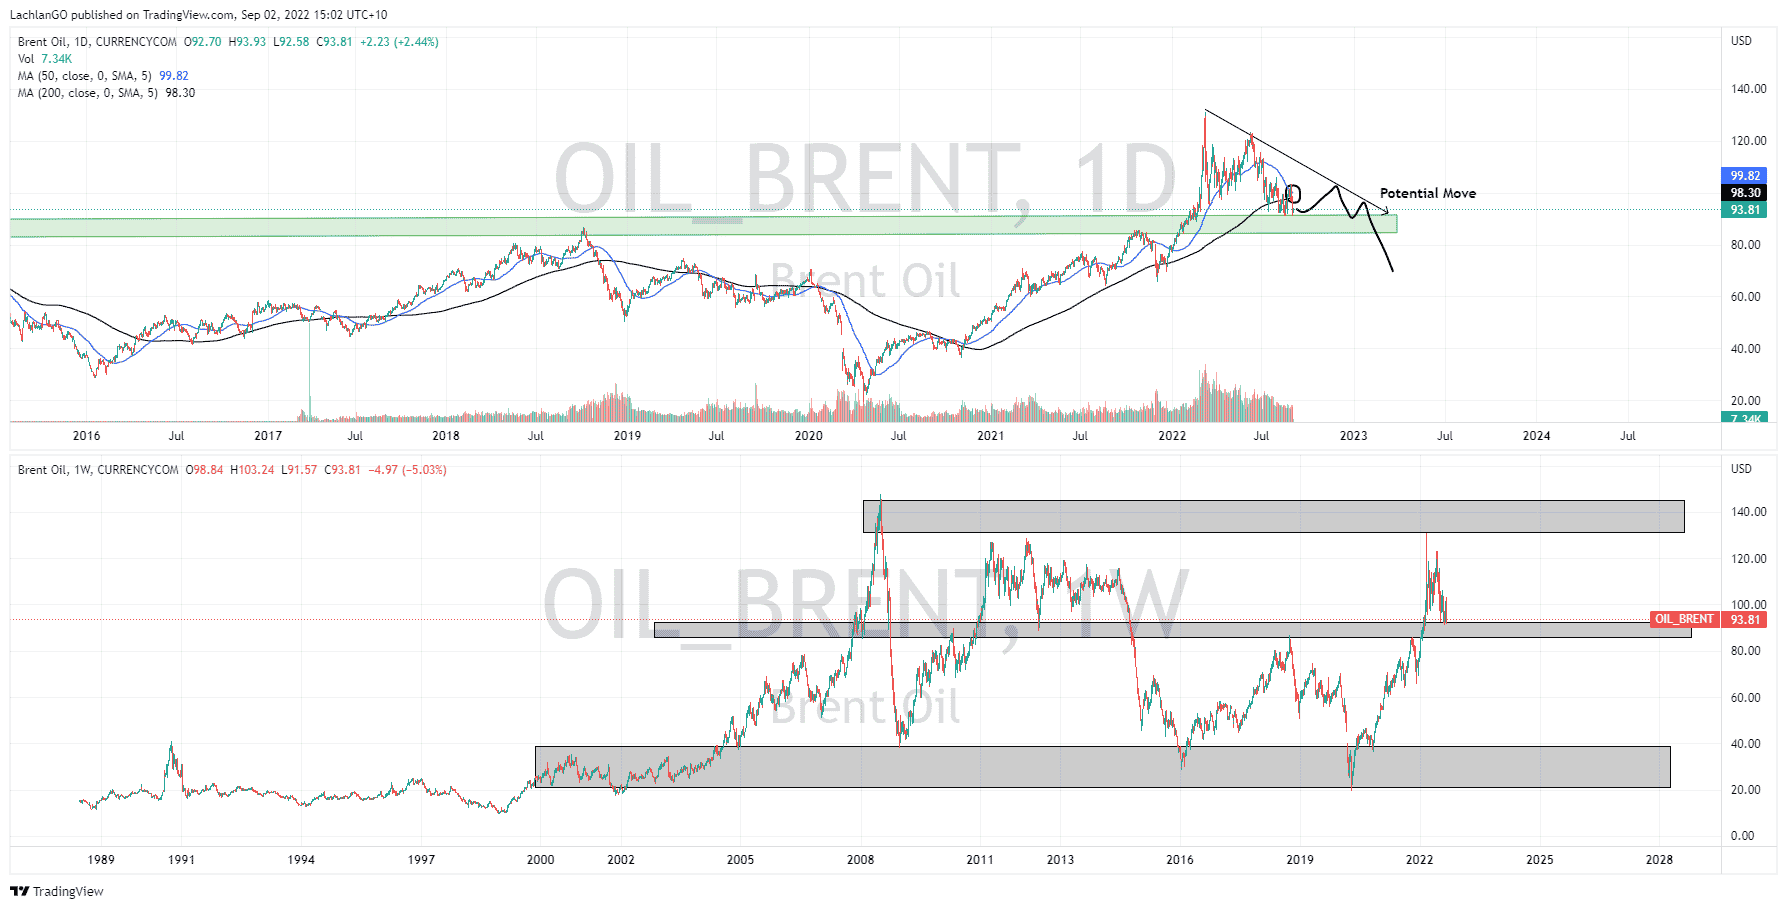
Brent Crude oil much like many other commodities has seen its value drop on the back of a strong US dollar and weaker demand forecasts. With the tail wind of the Russia and Ukraine crisis fading, Brent has struggled to maintain its highs of $125 a barrel in the last few months. In addition, the price has dropped to the point where it is retesting the critical $85-90 level. With more Covid fears in China and weak global growth, the demand is decreasing even with tight supply from major producer Saudi Arabia. OPEC is also due to meet next week on September 5 to discuss the future demand going ahead and earlier forecast its supply to be higher than the demand for the rest of 2022 before a potential deficit in 2023. The market will eagerly be waiting for the announcement from OPEC before deciding which way the price of Brent will go.
Technical analysis
As stated above, the price has dropped back to the lows of the range and it is retesting the long term support level. The price does look to be forming into a descending triangle pattern with potentially 1-2 more tests of the upper trend line before potentially breaking through the support zone. Whilst it is impossible to say at this stage if the price will hold the $85/90 level it is concerning to see the 50 day moving average inch closer to the 200 Day average. If it does cross through it may signal that a sell off is imminent. In addition, the price was unable to move above the 50 Moving average. The price didn’t just reject the price, it comprehensively sold of the level with an aggressive bearish candlestick highlighting the strength of the sellers.
It should be noted that looking at the longer term chart the strength of the $85-90 support level become more apparent. Not only is it a support but also the mean of the 20-year range for the price. Therefore, to break this support level will require a very powerful sell off.

The information provided is of general nature only and does not take into account your personal objectives, financial situations or needs. Before acting on any information provided, you should consider whether the information is suitable for you and your personal circumstances and if necessary, seek appropriate professional advice. All opinions, conclusions, forecasts or recommendations are reasonably held at the time of compilation but are subject to change without notice. Past performance is not an indication of future performance. Go Markets Pty Ltd, ABN 85 081 864 039, AFSL 254963 is a CFD issuer, and trading carries significant risks and is not suitable for everyone. You do not own or have any interest in the rights to the underlying assets. You should consider the appropriateness by reviewing our TMD, FSG, PDS and other CFD legal documents to ensure you understand the risks before you invest in CFDs. These documents are available here.
#SpotGold #SpotSilver #GoldTrading #SilverTrading #SpotWTICrudeOil #WTICrudeOil #SpotBrentCrudeOil #BrentCrudeOil #OilTrading #Commodities #CommoditiesTrading #CommodityMarket #CommodityTradingNext Article
The week ahead – ECB, RBA, BoC and Fed headline a data heavy calendar
Global equities saw a steep sell-off last week as economic concerns, the European energy crunch and increasingly hawkish Central banks weighed on market sentiment and saw investors paring back on risk assets. Friday’s session saw a mixed Non-farm payroll announcement, with a beat on the headline figure offset by weaker than expected wage growt...
September 5, 2022Read More >Previous Article
Bitcoin/USD – Technical Analysis
After Bitcoin reached its all time highs around $69,000USD per coin in November of 2021, it’s been downhill ever since. Currently sitting at rou...
September 2, 2022Read More >Please share your location to continue.
Check our help guide for more info.

- Trading
