- Trading
- Trading
- Markets
- Markets
- Products overview
- Forex
- Commodities
- Metals
- Indices
- Shares
- Cryptocurrencies
- Treasuries
- Platforms
- Platforms
- Platforms
- Platforms
- Platforms overview
- MetaTrader 4
- MetaTrader 5
- Education
- Education
- Education
- Education
- News & analysis
- Education Hub
- Economic calendar
- Help & support
- Help & support
- About
- Trading
- Trading
- Markets
- Markets
- Products overview
- Forex
- Commodities
- Metals
- Indices
- Shares
- Cryptocurrencies
- Treasuries
- Platforms
- Platforms
- Platforms
- Platforms
- Platforms overview
- MetaTrader 4
- MetaTrader 5
- Education
- Education
- Education
- Education
- News & analysis
- Education Hub
- Economic calendar
- Help & support
- Help & support
- About
- Home
- News & Analysis
- Oil, Metals, Soft Commodities
- Global Oil Sentiment May Assist The Loonie
- Home
- News & Analysis
- Oil, Metals, Soft Commodities
- Global Oil Sentiment May Assist The Loonie
 News & AnalysisNews & Analysis
The US Dollar has been crushing it this week against many of the major currency pairs with most of the market chatter surrounding additional rate hikes from the Fed. We’ll look at the USDCAD, also referred to as the “Loonie,” a pairing that has survived the recent onslaught thanks to its ties to global oil prices and the bullish sentiment surrounding the commodity.
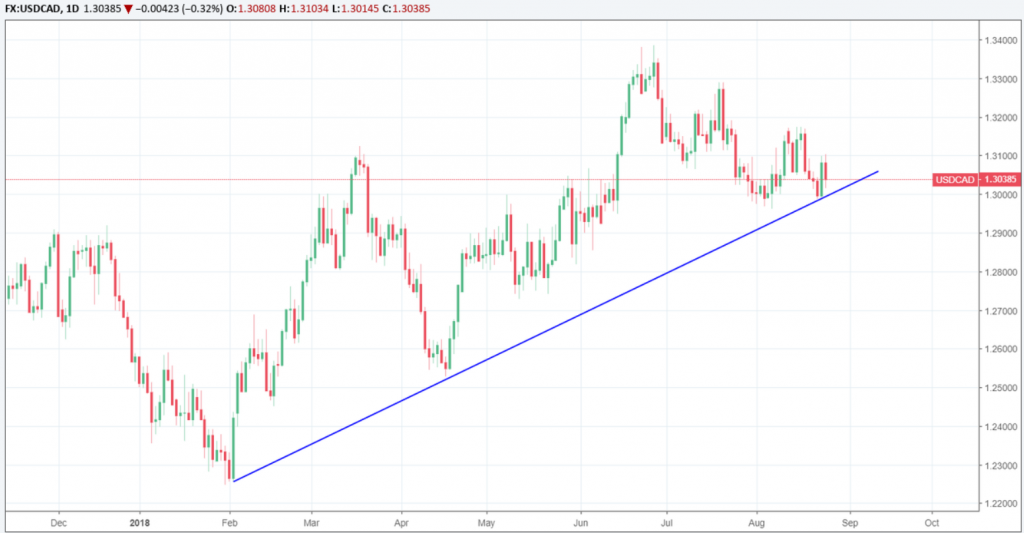
USDCAD – Daily Chart
First up, we can see a clear bullish trend on the daily candlestick chart. There appears plenty of support centred around the 1.30 level, which has been a significant level for quite some time making it a crucial psychological barrier too. We can see the Dollar did gain some traction but was unable to break the underlying trendline in that general vicinity.
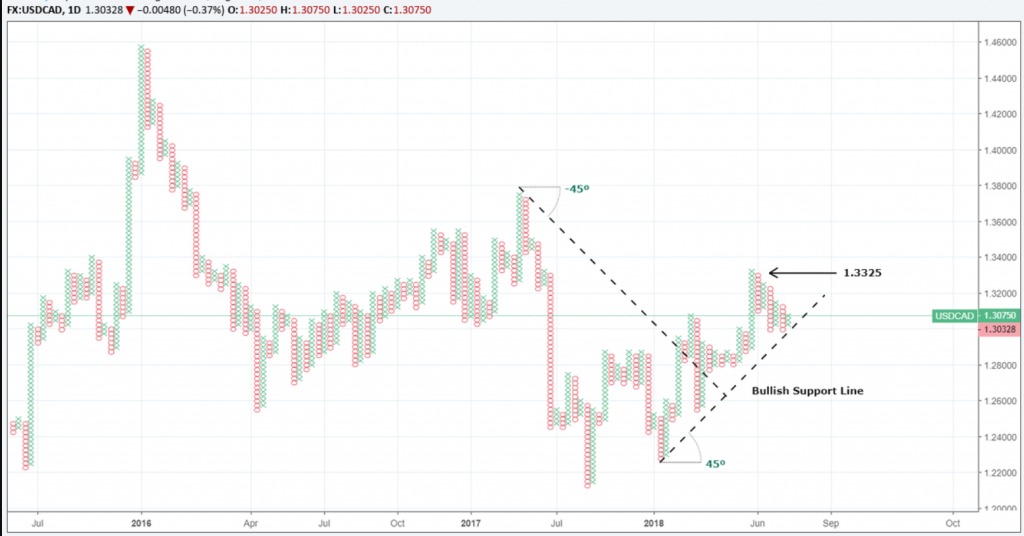
Should we see a bold move past the 1.30 mark, things may turn around for the Canadian Dollar in the longer-term. Past this support zone, the area of 1.28 looks promising. The following point and figure chart below shows this idea more clearly.
What we are looking at here is the potential for a change in the overall trend, where a bearish resistance line would emerge if the price slips under 1.30. Alternatively, this chart also provides us with an upside target should the Dollar regain composure; this is ear-marked at the recent high of 1.3325.
Now we turn to the price of oil and how its perceived strength could trickle into a stronger Canadian Dollar.
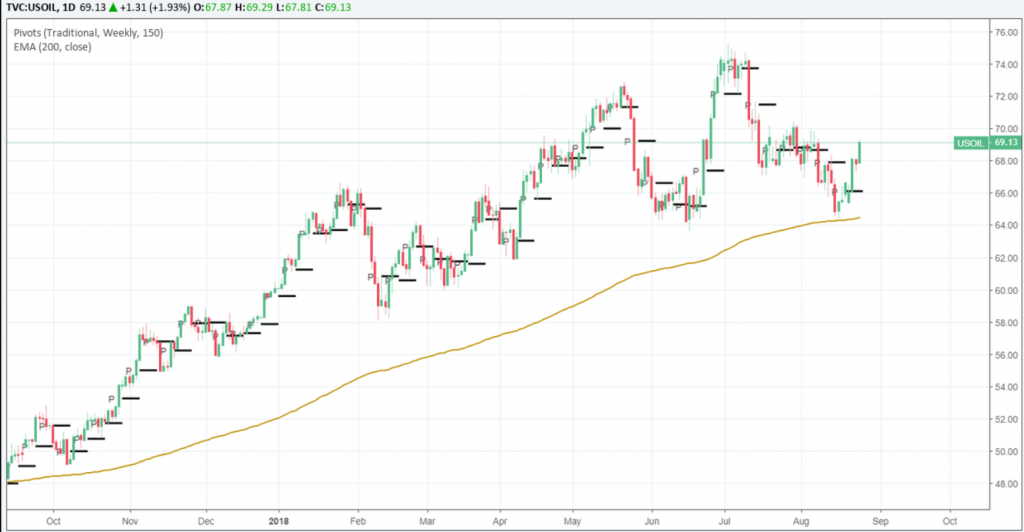
USOIL – Daily Chart
The daily chart of oil above displays the current uptrend in the commodity, most noticeably, the price action bounce off the 200-day moving average line in gold. This is a further bullish sign which helps address overall sentiment. I’ve discussed this bull trend in previous articles, and I still believe we could potentially visit the 72.00 and 74.00 regions in the not-too-distant future.
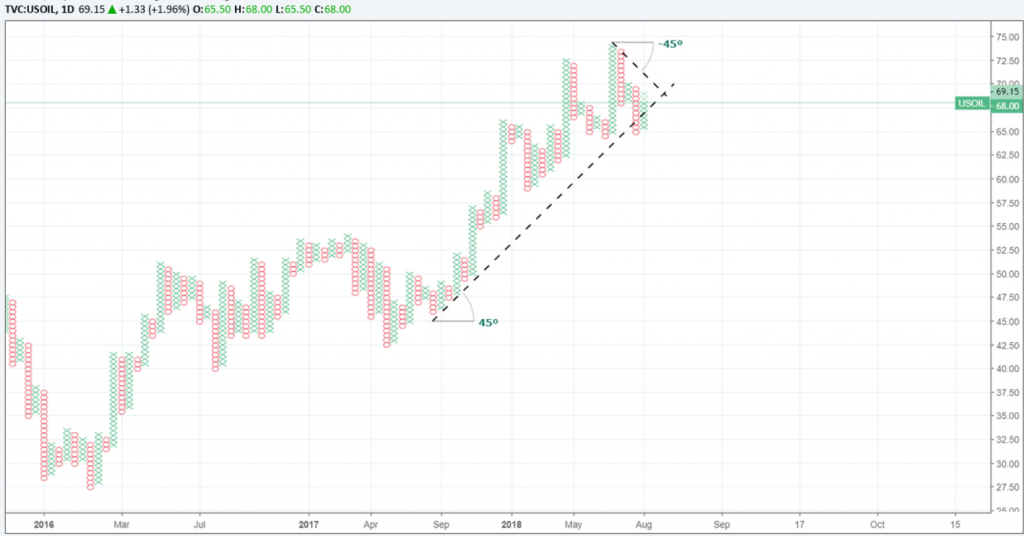
Unfortunately, the oil point and figure chart below is less complimentary to this analysis. You may remember in the Snapshot article that I discussed that an increase in supply past 68.00 would suggest revising the overall trend – this has happened recently. Technically speaking, we have since switched to a bearish resistance line as shown, however there is a caveat to be mindful of in this instance.
If price action heads back upwards closing above the 70.00 region, then we will have a situation whereby the recent move becomes a new area of support.
In short, when price generates a sell signal followed by a buy signal on an uptrend (Bullish Support Line), we then adjust the trendline accordingly. I suspect this might be the case, meaning recent activity would represent nothing more than a short-term correction. Typically, stronger oil prices will benefit the Canadian Dollar or at least help shield it from overall Dollar advances.
By Adam Taylor CFTe
Market Analyst
This article is written by a GO Markets Analyst and is based on their independent analysis. They remain fully responsible for the views expressed as well as any remaining error or omissions. Trading Forex and Derivatives carries a high level of risk.
Sources: TradingView.com
The information provided is of general nature only and does not take into account your personal objectives, financial situations or needs. Before acting on any information provided, you should consider whether the information is suitable for you and your personal circumstances and if necessary, seek appropriate professional advice. All opinions, conclusions, forecasts or recommendations are reasonably held at the time of compilation but are subject to change without notice. Past performance is not an indication of future performance. Go Markets Pty Ltd, ABN 85 081 864 039, AFSL 254963 is a CFD issuer, and trading carries significant risks and is not suitable for everyone. You do not own or have any interest in the rights to the underlying assets. You should consider the appropriateness by reviewing our TMD, FSG, PDS and other CFD legal documents to ensure you understand the risks before you invest in CFDs. These documents are available here.
#SpotGold #SpotSilver #GoldTrading #SilverTrading #SpotWTICrudeOil #WTICrudeOil #SpotBrentCrudeOil #BrentCrudeOil #OilTrading #Commodities #CommoditiesTrading #CommodityMarket #CommodityTradingNext Article
The Art Of War And Trading: Part 1
What Is The Art Of War? The Art of War is an ancient Chinese book on military tactics and strategy who written by Sun Tzu around 500 BC. These writings are considered by many to be the most significant literature on military tactics and wisdom that can be applied to everyday life ever conceived. In this multi-article series, we will be interpreting...
August 28, 2018Read More >Previous Article
World Trade – Winners and Losers
We hear a lot these days about countries having ''trade wars'' between each other, most recently the United States vs China ''trade war'' which was in...
August 24, 2018Read More >Please share your location to continue.
Check our help guide for more info.

- Trading


