- Trading
- Trading
- Markets
- Markets
- Products overview
- Forex
- Commodities
- Metals
- Indices
- Shares
- Cryptocurrencies
- Treasuries
- Platforms
- Platforms
- Platforms
- Platforms
- Platforms overview
- MetaTrader 4
- MetaTrader 5
- Education
- Education
- Education
- Education
- News & analysis
- Education Hub
- Economic calendar
- Help & support
- Help & support
- About
- Trading
- Trading
- Markets
- Markets
- Products overview
- Forex
- Commodities
- Metals
- Indices
- Shares
- Cryptocurrencies
- Treasuries
- Platforms
- Platforms
- Platforms
- Platforms
- Platforms overview
- MetaTrader 4
- MetaTrader 5
- Education
- Education
- Education
- Education
- News & analysis
- Education Hub
- Economic calendar
- Help & support
- Help & support
- About
- Home
- News & Analysis
- Oil, Metals, Soft Commodities
- Gold Reverses from 1960 following strong US NFP data
- Home
- News & Analysis
- Oil, Metals, Soft Commodities
- Gold Reverses from 1960 following strong US NFP data
 News & AnalysisNews & Analysis
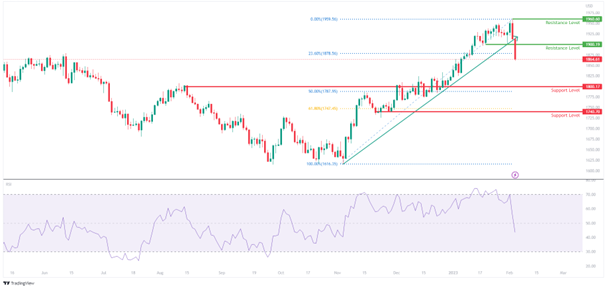
Gold had been on a steady rally to the upside with the price climbing along the bullish trendline from the 1620 price level in November 2022 to reach a high of 1960 in February 2023. This move higher was driven by general market anticipation that the US Federal Reserve would pivot on its current monetary policy, slowing down or pausing future interest rate hikes sooner than expected.
Fundamental Overview
Last week, the US Federal Reserve, European Central Bank, and Bank of England increased their respective interest rates by 50bps. With the central banks continuing to hike rates, and real yields rising again, gold could be viewed as a less attractive investment option.On Friday, the US non-farm employment change data was released stronger than expected at 517k (Forecast: 193k) and the US unemployment rate fell to 3.4%. This led to a significant recovery in strength for the DXY, with the price climbing to the 103 price area.
Technical Overview
As the DXY strengthened, the negatively correlated Gold saw a sharp pullback, with the price trading down to the 1864.61 price level. The retracement in Gold saw it break through several key technical bullish elements, in particular, the bullish trendline from November, the 1900 round number support level, and the first Fibonacci retracement level of 23.6%, leading to the near-term technical outlook for Gold to shift from bullish to be short-term bearish.A deeper correction to the downside can be expected, as the Relative Strength Index (RSI) reversed strongly from the overbought region and through the 50.0 level. However, the downside momentum could find support between the price range of 1800 and 1740 price range, formed by the 50% and 61.80% Fibonacci retracement levels respectively.

Disclaimer: Articles are from GO Markets analysts and contributors and are based on their independent analysis or personal experiences. Views, opinions or trading styles expressed are their own, and should not be taken as either representative of or shared by GO Markets. Advice, if any, is of a ‘general’ nature and not based on your personal objectives, financial situation or needs. Consider how appropriate the advice, if any, is to your objectives, financial situation and needs, before acting on the advice. If the advice relates to acquiring a particular financial product, you should obtain and consider the Product Disclosure Statement (PDS) and Financial Services Guide (FSG) for that product before making any decisions.
The information provided is of general nature only and does not take into account your personal objectives, financial situations or needs. Before acting on any information provided, you should consider whether the information is suitable for you and your personal circumstances and if necessary, seek appropriate professional advice. All opinions, conclusions, forecasts or recommendations are reasonably held at the time of compilation but are subject to change without notice. Past performance is not an indication of future performance. Go Markets Pty Ltd, ABN 85 081 864 039, AFSL 254963 is a CFD issuer, and trading carries significant risks and is not suitable for everyone. You do not own or have any interest in the rights to the underlying assets. You should consider the appropriateness by reviewing our TMD, FSG, PDS and other CFD legal documents to ensure you understand the risks before you invest in CFDs. These documents are available here.
#SpotGold #SpotSilver #GoldTrading #SilverTrading #SpotWTICrudeOil #WTICrudeOil #SpotBrentCrudeOil #BrentCrudeOil #OilTrading #Commodities #CommoditiesTrading #CommodityMarket #CommodityTradingNext Article
Where to next for the USDJPY?
The stronger-than-expected US non-farm employment change data release last week saw the DXY climb strongly higher, beyond the 103 price level. With markets now anticipating that the US Federal Reserve could reinforce its hawkish stance, further upside is expected for the DXY. On the other hand, uncertainty rises over the Bank of Japan’s (BoJ) ...
February 7, 2023Read More >Previous Article
“Deflationary process has begun” as Federal Reserve increase Funds rate by 25 bps
The US equities market has had a sharp rise to end the trading session as the Federal Reserve announced a 25-bps interest rate rise. Whilst the market...
February 2, 2023Read More >Please share your location to continue.
Check our help guide for more info.

- Trading
