- Trading
- Trading
- Markets
- Markets
- Products overview
- Forex
- Commodities
- Metals
- Indices
- Shares
- Cryptocurrencies
- Treasuries
- Platforms
- Platforms
- Platforms
- Platforms
- Platforms overview
- MetaTrader 4
- MetaTrader 5
- Education
- Education
- Education
- Education
- News & analysis
- Education Hub
- Economic calendar
- Help & support
- Help & support
- About
- Trading
- Trading
- Markets
- Markets
- Products overview
- Forex
- Commodities
- Metals
- Indices
- Shares
- Cryptocurrencies
- Treasuries
- Platforms
- Platforms
- Platforms
- Platforms
- Platforms overview
- MetaTrader 4
- MetaTrader 5
- Education
- Education
- Education
- Education
- News & analysis
- Education Hub
- Economic calendar
- Help & support
- Help & support
- About
- Home
- News & Analysis
- Shares and Indices
- ASX200 breaks out on the back of softer RBA interest rate hike
- Home
- News & Analysis
- Shares and Indices
- ASX200 breaks out on the back of softer RBA interest rate hike
 News & AnalysisNews & Analysis
The ASX200 has seen some positive price action in recent weeks as the Australian equities market has benefited from relatively weaker inflation then much of the rest of the world. With the Reserve Bank of Australia, (RBA) only increasing interest rates by 25 bps at each of its last two meeting, the country’s central bank has seemingly chosen that inflation is perhaps the lessor of two evils against the potential of a recession. On the other hand, with expected inflation to increase to 8%, the RBA may be hoping for a softer landing and slower move to control inflation.

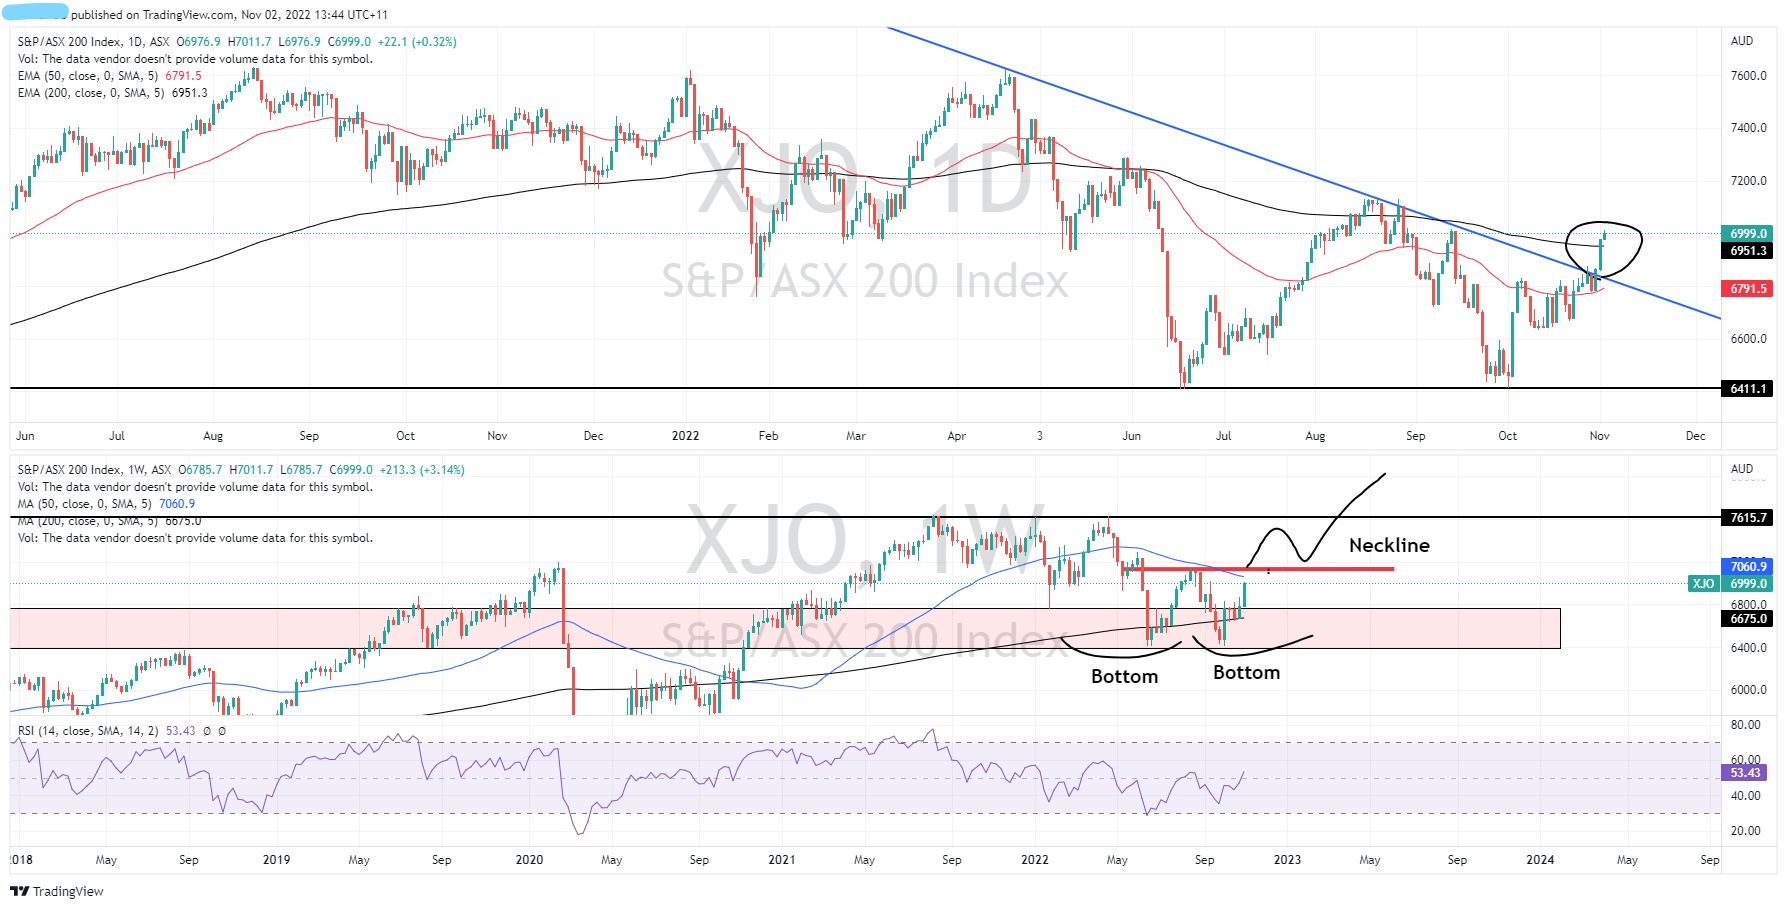
In response to the two most recent cash rate changes, the ASX200 has been the beneficiary with the index testing its two-month high. On the weekly chart, the index has so far bounced off its long-term support zone and its 200-week moving average. This may indicate that the index has ‘bottomed’ at least in the short term. The price is also showing signs of a potential double bottom reversal pattern, with the two bottoms being at approximately 6500 points. If the price can break through the neckline and confirm itself as a double bottom it may accelerate through and test the all-time high resistance at 7617.
On the daily chart the index shows some further encouraging signs of a reversal or breakout. The index has broken out of the down channel in the last two days and has reclaimed both the 50 day and 200 day moving averages. In addition, the 50-day moving average is beginning to kick up, which indicates some short-term bullish sentiment.
It is important to remember that there may still be some headwinds with inflation and recessionary pressures still dictating much of the short-term price action, pushing higher may not be an easy feat.
The information provided is of general nature only and does not take into account your personal objectives, financial situations or needs. Before acting on any information provided, you should consider whether the information is suitable for you and your personal circumstances and if necessary, seek appropriate professional advice. All opinions, conclusions, forecasts or recommendations are reasonably held at the time of compilation but are subject to change without notice. Past performance is not an indication of future performance. Go Markets Pty Ltd, ABN 85 081 864 039, AFSL 254963 is a CFD issuer, and trading carries significant risks and is not suitable for everyone. You do not own or have any interest in the rights to the underlying assets. You should consider the appropriateness by reviewing our TMD, FSG, PDS and other CFD legal documents to ensure you understand the risks before you invest in CFDs. These documents are available here.
#Indice #Indices #IndicesTrading #IndexTrading #Shares #Stockmarket #StocksNext Article
Airbnb sets a new quarterly record – disappoints on guidance
Airbnb Inc. (NAS:ABNB) reported its latest financial results after the closing bell in the US on Tuesday. World’s second largest online travel company beat both revenue and earnings per share (EPS) estimates for the quarter. Revenue reported at $2.884 billion (up by 29% year-over-year) vs. $2.852 billion expected. EPS at $1.79 per share ...
November 3, 2022Read More >Previous Article
Stocks down, USD and Yields up ahead of key FOMC meeting
US stocks slid in a choppy session where a positive open soon sold off sharply on the back of a positive JOLTS report sparking a “good news is bad n...
November 2, 2022Read More >Please share your location to continue.
Check our help guide for more info.

- Trading
