- Trading
- Trading
- Markets
- Markets
- Products overview
- Forex
- Commodities
- Metals
- Indices
- Shares
- Cryptocurrencies
- Treasuries
- Platforms
- Platforms
- Platforms
- Platforms
- Platforms overview
- MetaTrader 4
- MetaTrader 5
- Education
- Education
- Education
- Education
- News & analysis
- Education Hub
- Economic calendar
- Help & support
- Help & support
- About
- Trading
- Trading
- Markets
- Markets
- Products overview
- Forex
- Commodities
- Metals
- Indices
- Shares
- Cryptocurrencies
- Treasuries
- Platforms
- Platforms
- Platforms
- Platforms
- Platforms overview
- MetaTrader 4
- MetaTrader 5
- Education
- Education
- Education
- Education
- News & analysis
- Education Hub
- Economic calendar
- Help & support
- Help & support
- About
- Home
- News & Analysis
- Shares and Indices
- ASX200 resting on a knifes edge
News & AnalysisInflation and recessionary pressures have caused the aggressive sell offs of some of the largest global indices, however so far, the ASX200 or XJO has fared relatively well. However, there are worrying signs that a resilient XJO may be coming to an end. Whilst the inflation rate in Australia is still at levels that are low compared to much of the rest world giving the Reserve Bank of Australia flexibility in how it attacks the inflation problem.
The Australian dollar has seen a sell off as commodity prices have come falling. In addition, as risk sentiment has shifted money has moved away from the AUD as it is seen as a drop which has not been helpful to the overall Australian market. At the same time the USD has been on an absolute tear as market players look to move their money into safer asset classes.
The broader macroeconomic factors and connectiveness of global markets is beginning to take its toll on the XJO. With the outlook in America looking very bearish and the UK and Europe looking likely to enter a recession has already caused some aggressive selling in Australia especially across its growth companies.
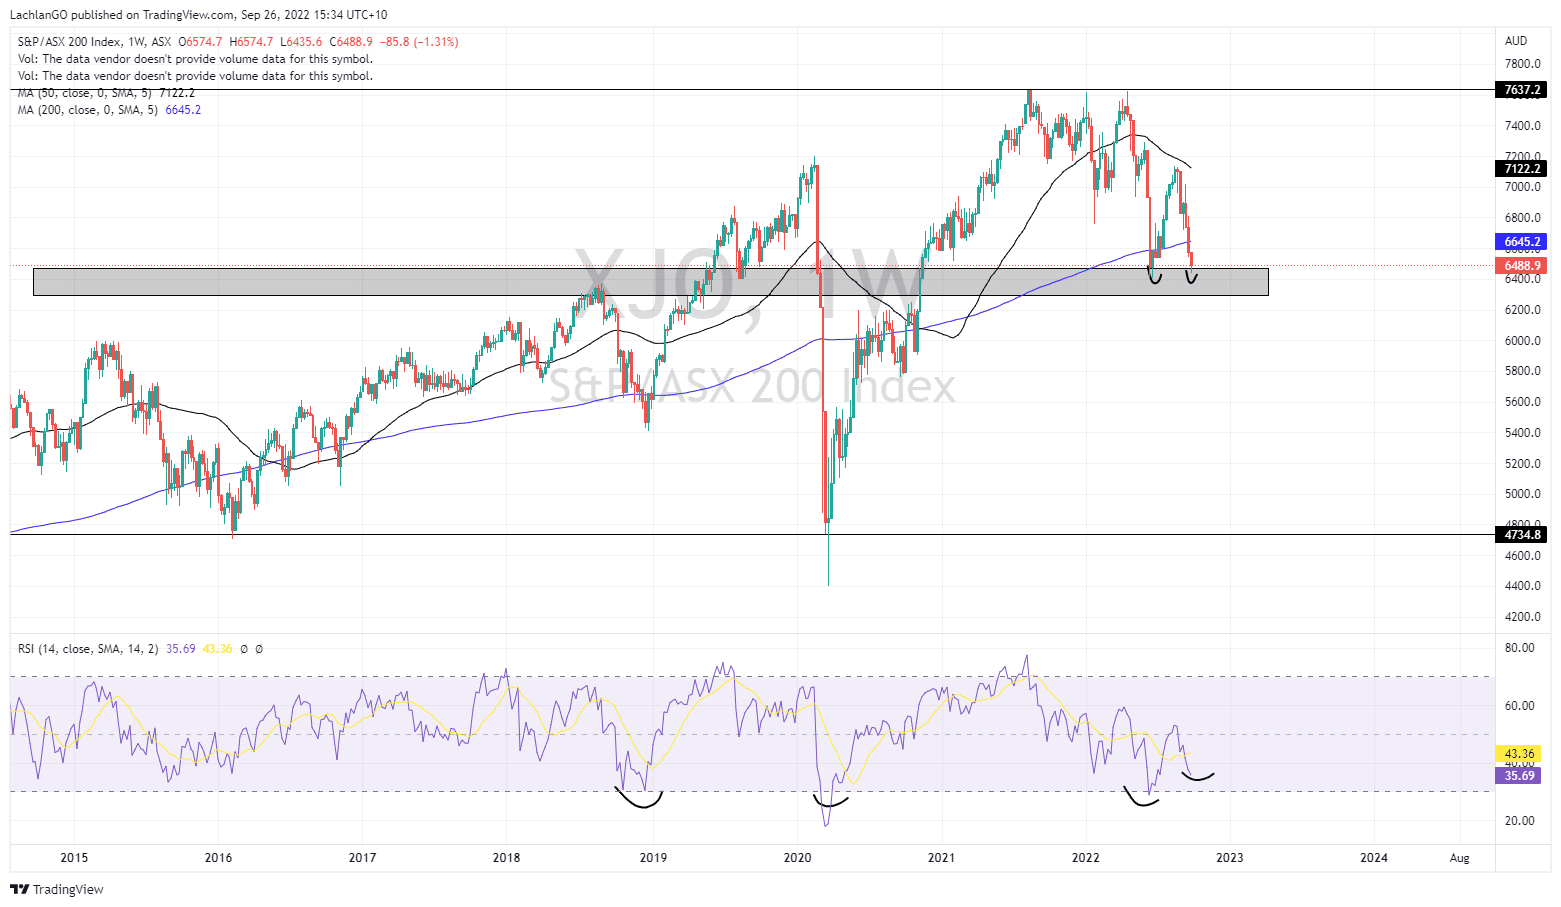
This XJO has dropped to its lowest level in more than 6 months. The weekly price chart shows that the recent sell off is ready to test the long-term support zone between 6300-6500 points. In addition, the price has broken through the 200-week moving average which is a cause for concern as it may indicate that the bearish trend will continue. Another concern is that the RSI which has been a reasonable predictor of the bottom of pullbacks is yet to reach the same oversold level as it was on the previous bounces, which may indicate that there is more selling to come.

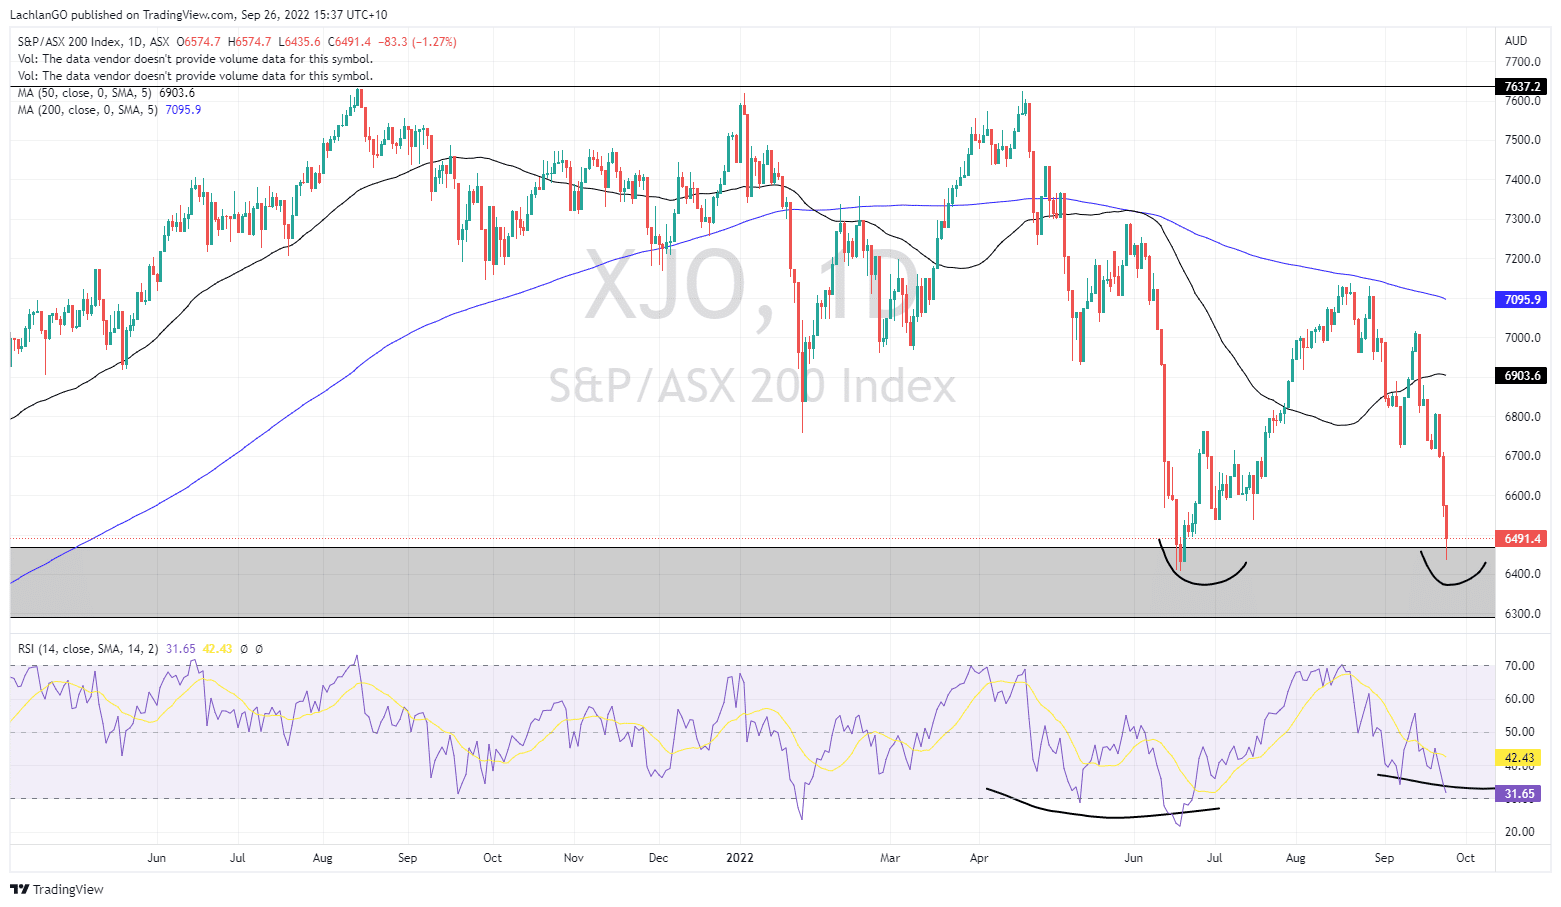
The daily chart is slightly more encouraging. Although it still shows the price of the XJO testing the support zone, it does show that the price has already bounced off the support. However, as the week progresses, there may still be cause for the index to drop further, especially if the conditions in the US and Europe continue to worsen. With the recessionary fears dictating much of the direction of the market, a break through the support zone is still a realistic possibility in the short term.

The information provided is of general nature only and does not take into account your personal objectives, financial situations or needs. Before acting on any information provided, you should consider whether the information is suitable for you and your personal circumstances and if necessary, seek appropriate professional advice. All opinions, conclusions, forecasts or recommendations are reasonably held at the time of compilation but are subject to change without notice. Past performance is not an indication of future performance. Go Markets Pty Ltd, ABN 85 081 864 039, AFSL 254963 is a CFD issuer, and trading carries significant risks and is not suitable for everyone. You do not own or have any interest in the rights to the underlying assets. You should consider the appropriateness by reviewing our TMD, FSG, PDS and other CFD legal documents to ensure you understand the risks before you invest in CFDs. These documents are available here.
#Indice #Indices #IndicesTrading #IndexTrading #Shares #Stockmarket #StocksNext Article
More downside for major cryptos?
Following the previous Bitcoin analysis (https://www.int.gomarkets.com/articles/economic-updates/bitcoin-usd-technical-analysis/), bitcoin continues to break below pattern after pattern, recently breaking out and re-testing a descending flag pattern on a 4h time frame as seen below: With the next major support sitting around $17,619, it won�...
September 27, 2022Read More >Previous Article
Market await FOMC Interest rate decision
In what has been a heavily anticipated market event at 4:00am EST Australia, the US federal Reserve is set to release its changed ...
September 21, 2022Read More >Please share your location to continue.
Check our help guide for more info.

- Trading

