- Trading
- Trading
- Markets
- Markets
- Products overview
- Forex
- Commodities
- Metals
- Indices
- Shares
- Cryptocurrencies
- Treasuries
- Platforms
- Platforms
- Platforms
- Platforms
- Platforms overview
- MetaTrader 4
- MetaTrader 5
- Education
- Education
- Education
- Education
- News & analysis
- Education Hub
- Economic calendar
- Help & support
- Help & support
- About
- Trading
- Trading
- Markets
- Markets
- Products overview
- Forex
- Commodities
- Metals
- Indices
- Shares
- Cryptocurrencies
- Treasuries
- Platforms
- Platforms
- Platforms
- Platforms
- Platforms overview
- MetaTrader 4
- MetaTrader 5
- Education
- Education
- Education
- Education
- News & analysis
- Education Hub
- Economic calendar
- Help & support
- Help & support
- About
- Home
- News & Analysis
- Shares and Indices
- JD.com beats expectations
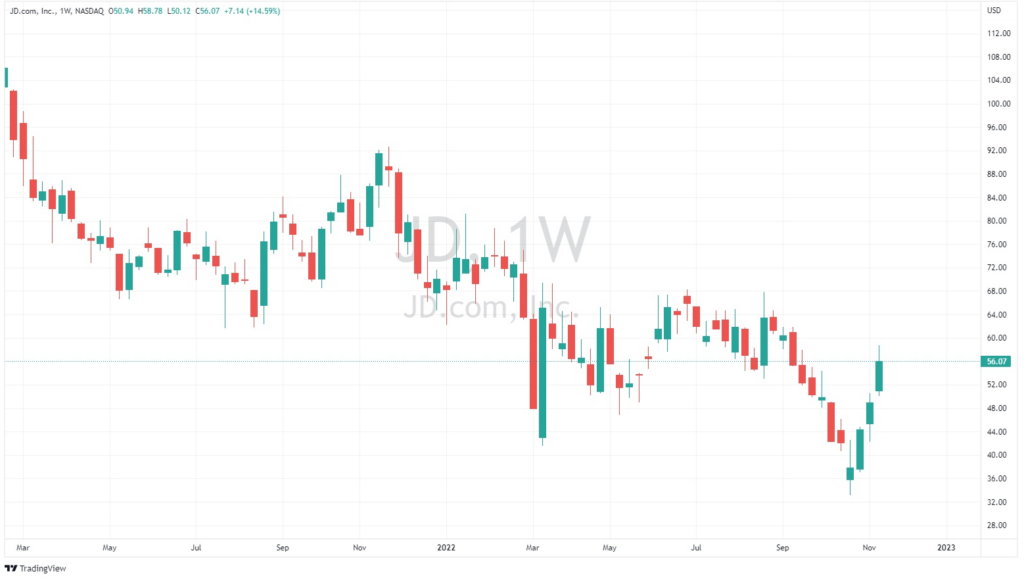
- 1 month: +33.14%
- 3 month: +60%
- Year-to-date: -19.91%
- 1 year: -38.70%
- Barclays: $59
- Citigroup: $85
- Goldman Sachs: $89
- Benchmark: $106
- JP Morgan: $58
- Mizuho: $90
- HSBC: $91
- Morgan Stanley: $85
News & AnalysisJD.com Inc. (NASDAQ: JD, HKEX: 9618) reported its latest earnings results for the three months that ended September 30, 2022, on Friday.
The Chinese e-commerce company had a solid quarter – beating revenue and earnings per share (EPS) forecasts.
JD reported revenue of $34.373 billion (up by 11.4% from the previous quarter) vs. $34.145 billion estimate.
EPS reported at $0.885 per share vs. $0.685 per share expected.
”JD.com’s relentless focus on user experience, cost and efficiency has allowed us to continuously expand our user base while delivering profitable growth,” Sandy Xu, CFO of the company said in a press release.
”Our pre-emptive efforts earlier this year to promote operating efficiency and financial discipline have proven timely and effective given the ongoing external challenges. We will continue to focus on capturing the vast opportunity presented by China’s retail market by striving to be the partner of choice for China’s consumers and enterprises,” Xu added.

Share of JD were down by around 3% on Friday at $56.01 a share.
Stock performance
JD.com price targets
JD.com is the 146th largest company in the world with a market cap of $89.10 billion.
You can trade JD.com Inc. (NASDAQ: JD, HKEX: 9618) and many other stocks from the NYSE, NASDAQ, HKEX, ASX, LSE and DE with GO Markets as a Share CFD.
Sources: JD.com Inc., TradingView, MarketWatch, MetaTrader 5, Benzinga, CompaniesMarketCap
The information provided is of general nature only and does not take into account your personal objectives, financial situations or needs. Before acting on any information provided, you should consider whether the information is suitable for you and your personal circumstances and if necessary, seek appropriate professional advice. All opinions, conclusions, forecasts or recommendations are reasonably held at the time of compilation but are subject to change without notice. Past performance is not an indication of future performance. Go Markets Pty Ltd, ABN 85 081 864 039, AFSL 254963 is a CFD issuer, and trading carries significant risks and is not suitable for everyone. You do not own or have any interest in the rights to the underlying assets. You should consider the appropriateness by reviewing our TMD, FSG, PDS and other CFD legal documents to ensure you understand the risks before you invest in CFDs. These documents are available here.
#Indice #Indices #IndicesTrading #IndexTrading #Shares #Stockmarket #StocksNext Article
Markets continue to be uncertain as choppy conditions continue
Markets continue to be uncertain as choppy conditions continue It was another mixed bag for the equity market last week as traders and investors tried to make sense of the current rally. With the indices seemingly pausing from their rally the market is still yet to determine if this current momentum is a true reversal and a sign of a potenti...
November 21, 2022Read More >Previous Article
FTX, a failure in Corporate Governance and effective risk management
The FTX bankruptcy case has been a fascinating study in the failure of corporate governance providing a warning to the Cryptocurrency industry that a ...
November 18, 2022Read More >Please share your location to continue.
Check our help guide for more info.

- Trading

